


As you start to incorporate more advanced filters and interactivity in your dashboards, you might notice Tableau is not working the way you expect it to.
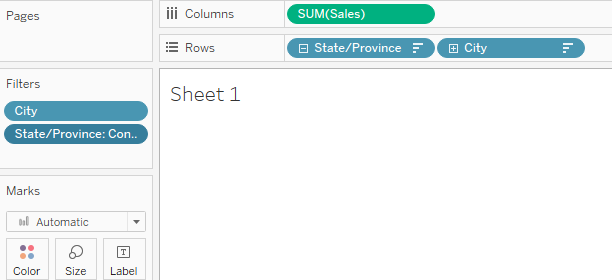
Let’s use a superstore example, you made a bar chart of the sum of sales categorized by state and city.
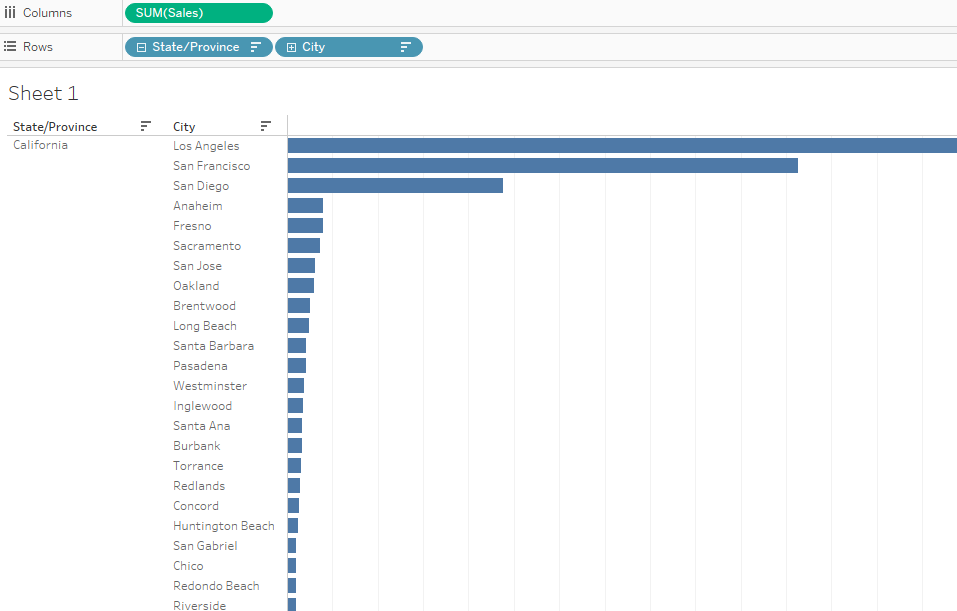
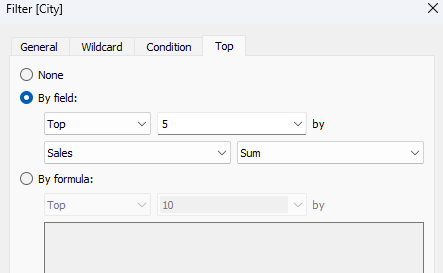
Now you want to keep only cities with the top 5 sales.
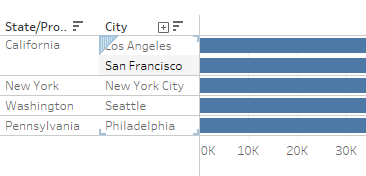
This is the result:
Now what if I want to see the top 5 cities in sales by a selected state?
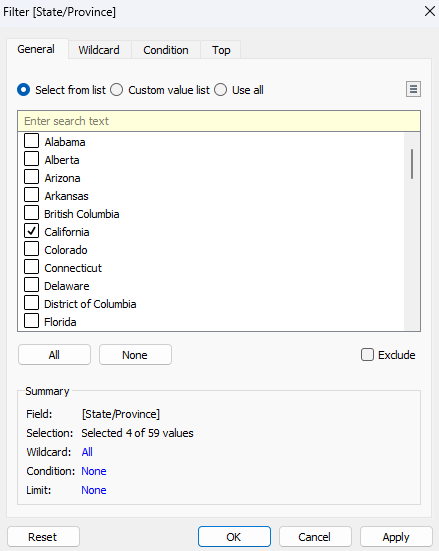
I would add state filter and keep only one state:
After adding the state filter, the chart is not acting the way I expected it to! I do not see the top 5 cities in California.
The reason behind this situation is due to Tableau’s Order of Operations:
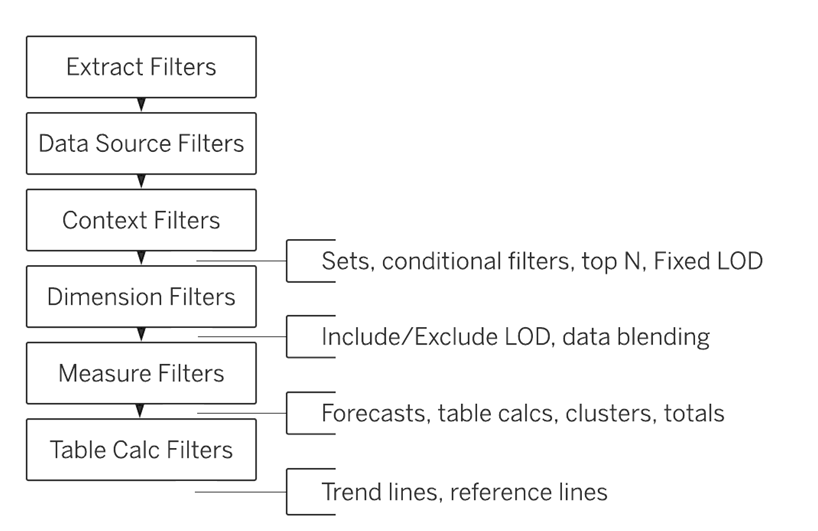
Tableau applies its filters based on a specific order such that there is alway a logical way to go about situations where there are multiple filters.
In our situation, we had a top N filter (the top 5 cities by sales) come before the dimension filter (state filter). What we really want is the other way around such that the states filter comes first before the Top N filter.
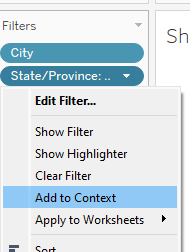
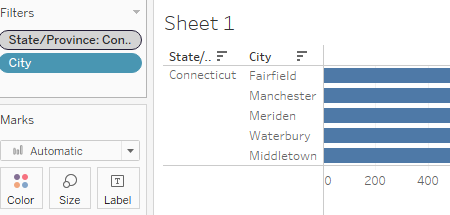
In this case we can make the state filter a context filter. A context filter comes before the top N filter and should create the result that we want.
It is important to keep in mind the various filters and the order in which Tableau performs them. When something is not going exactly the way you planned, always check your order of operations.
Photo by Brett Jordan on Unsplash