


Day 2 out of 5 is currently underway.
Today we were given a direction of the UNICEF data but no specific dataset. We are to choose a dataset of our interest and make a dashboard under the same guidelines as day 1.
After sourcing through the datasets, I landed my eyes on water and hygiene data. Although there were pre-loaded datasets available on the website, I decided to query my own data and fields from the Data Warehouse in UNICEF. After selecting the fields I was interested in, I then downloaded the file in a CSV format to input into Alteryx.
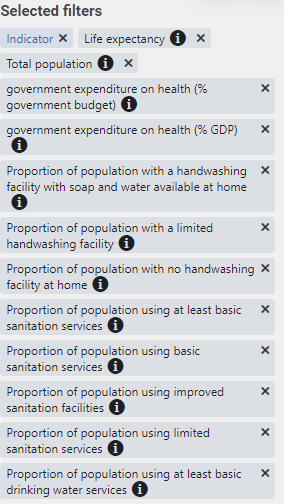
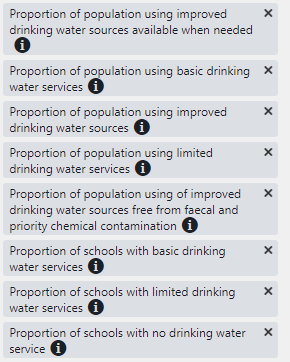
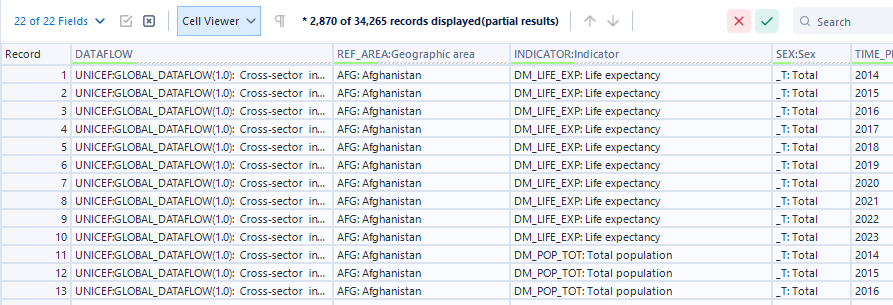
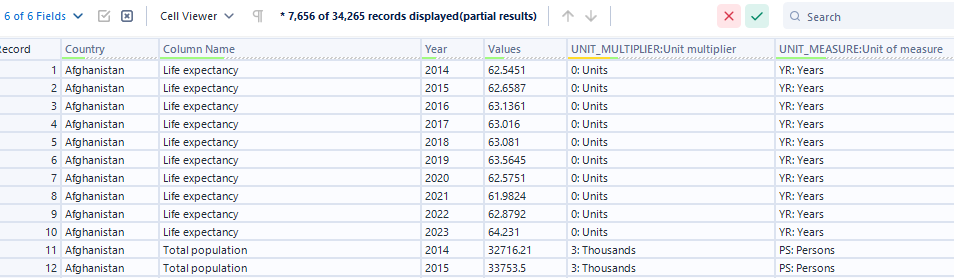
After taking a look at the data format in Alteryx, I noticed that there were 22 fields and 34,000+ rows of data. The data was in a long format where all the actual fields were in one column. To clean this file, I selected only the fields I needed and cleaned up some of the value names in the geographic area and indicator fields.
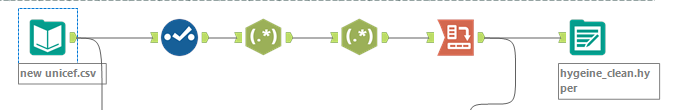
After cleaning the data, I pivoted the table from long to wide and outputted a hyper file ready for tableau:
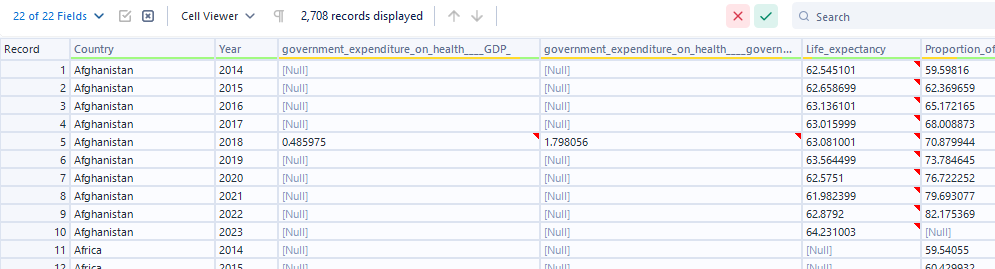
The cleaned file consists of 22 fields and 2,700+ rows.
With the countries field, I thought that a map would be an interesting and visually appealing chart to place in my dashboard. However, I also wanted a bar chart that was sorted in a way for users to find top countries easier. A chart switch using dynamic zone visibility did the trick where a user can switch between the two charts. I also created a few other charts to compare measures.
View my final dashboard here.
Photo by David Becker on Unsplash