Table Calculations are one of those key Tableau features that I’ve never entirely clicked with – I can handle a Quick Table Calc when finding Percent of Total or a Moving Average, but building out anything more complex always takes me a little longer than it should.
Nonetheless, working out the following solution gave me a great chance to revisit some Table Calc basics.
This example uses Superstore data.
The brief: compare Customer Count to this time last year
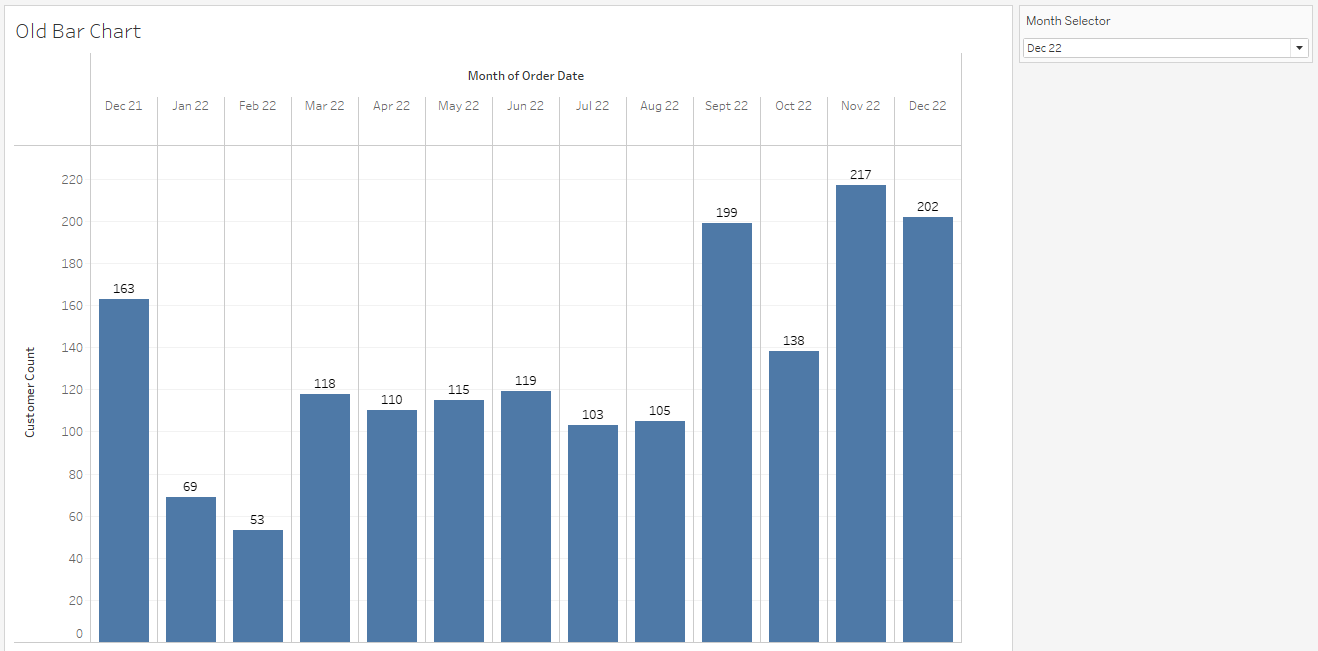
A stakeholder has a chart that shows monthly Customer Count for the this month and the last 12 months. They want to add in a second bar for each month that shows the previous year’s Customer Count value for comparison. This chart will feature on a dashboard where the user can change the date range of all charts using a date parameter (e.g. changing this parameter to ‘October 2022’ will cause charts to show values from October 2021 up to and including October 2022.
Step 1: create LOOKUP calculation
To start with, we can duplicate and rename the worksheet of the old chart. Remove the existing ‘Last 12 Months’ filter, so that we can see all months in the view during this step.
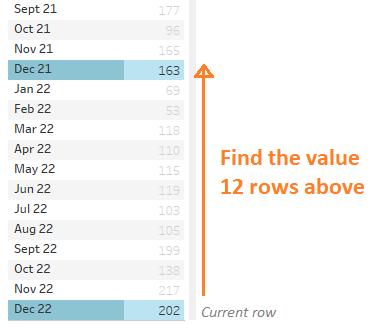
Now we can create a new calculated field that will return for each month the Customer Count value from 12 months earlier:
LOOKUP(COUNTD([Customer Name]), -12)
Tableau describes LOOKUP as returning ‘the value of the given expression in a target row, specified as a relative offset from the current row: the formula is LOOKUP(expression, [offset]).
So in this case, in plain English, the given expression we want is a Customer Count from 12 rows ago. It is easiest to picture this as a literal table of values, where we can count how many steps along the table we need to go.
Step 2: add to the chart
We can now add this new bar into the table using a Dual Axis.
Drag the LOOKUP calc field onto the left of the Rows shelf as a continuous measure (green). Right click the original COUNTD(Customer Name) measure and select ‘Dual Axis’, then right click the axis on the chart to select ‘Synchronise Axis’.
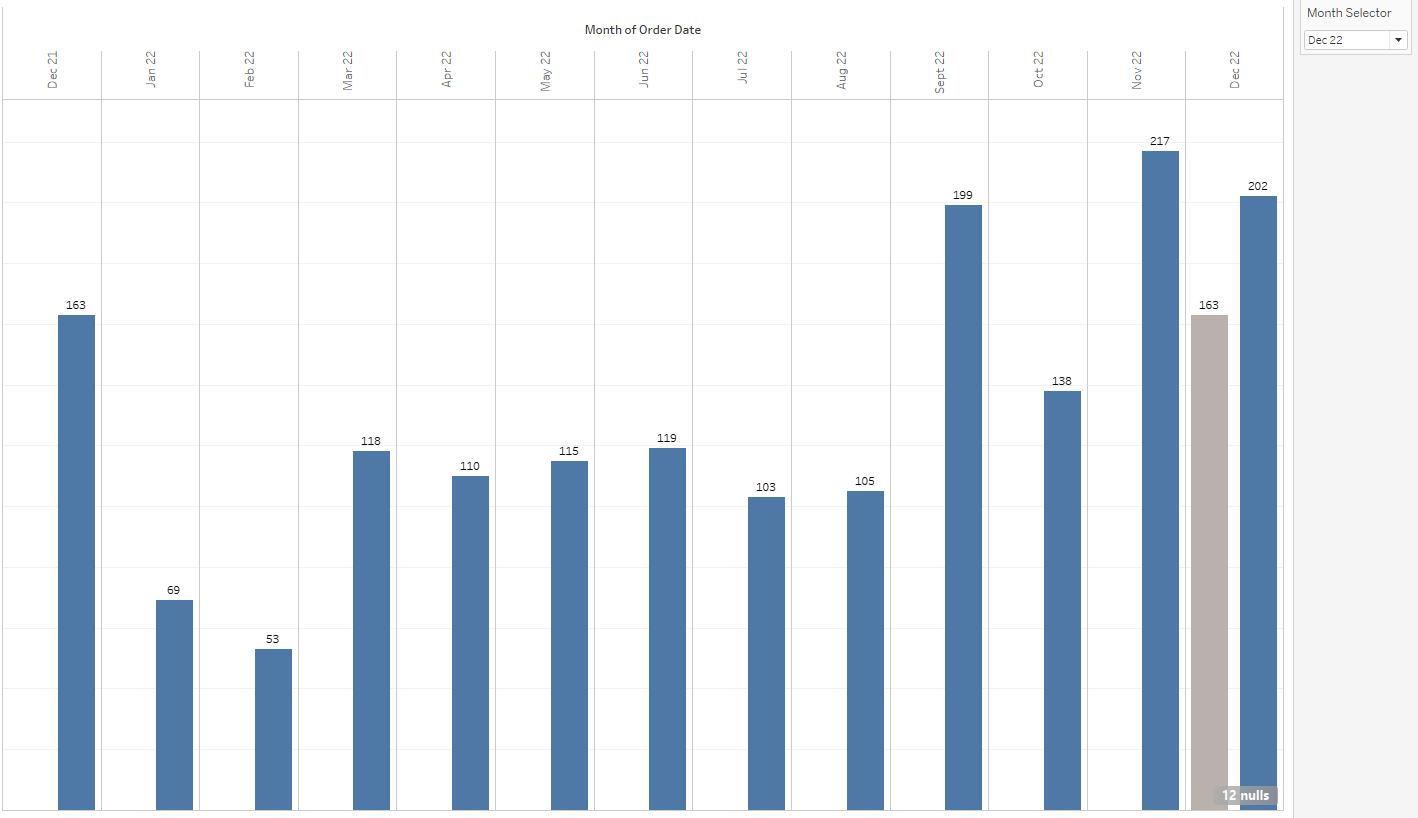
We can add Measure Names to the right of the Columns shelf to position bars side by side, and again on the colour marks card to colour the bars differently; here the grey bars show the value 12 months ago.
We can see that the Customer Count from a year ago is now shown for most months; the first few months in the chart do not have a second bar, since there is no earlier data to return.
Step 3: filter dates
The original version of this chart was filtered to only show values for the selected month, plus the twelve months before it.
We can try adding this filter back in; however, there is immediately something wrong. This filter gives us the correct range of months on our axis (December 2021-December 2022), but we lose the values from months outside of this range.
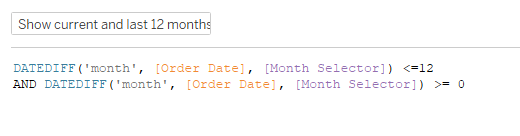
Looking at the calculation used for the original filter, we can see that it is a Boolean that checks if a given Order Date falls up to 12 months before date in our ‘Month Selector’ parameter.
This means that the data that we want to return in our LOOKUP calc is actually filtered out of the view, and so Tableau returns a NULL.
There is a workaround, however.
As noted in this Knowledge Base article, filters that are based on table calcs (as opposed to dimensions) do not filter out underlying data in this way: we will need to base our new filter on another LOOKUP calc.
LOOKUP(MIN(([Order Date])),0) <= [Month Selector]
AND LOOKUP(MIN(([Order Date])),0) >= (DATEADD('month', -12,[Month Selector]))
In plain English, this Boolean checks if the minimum Order Date falls before or on the selected month, but less than or equal to 12 months earlier than it.
We can add this to the filters shelf, select ‘True’, and see what happens when we change the Month Selector parameter value.