


For our fifth and final Dashboard Week project, DS30 were set the challenge of creating a dashboard with the dataset that was given to our most recent set of Data School applicants.
By now, the coaches were very familiar with this data (so would be able to spot any inconsistencies and errors!), and were curious to see if we could offer up any original new takes on it.
The dataset in question was from the Texas Department of Transportation, and recorded bike collision and crash data from the past decade in the city of Austin.
The brief:
Build something from your own analysis; you will have 10 minutes to present. Include a sketch and a user story. It should be obvious who your audience is and what actions they can take from what you create.
We were once again given quite an open-ended challenge for this dashboard, as we could define the user story for ourselves and make it as broad or specific as we liked.
My user story / making a plan:
My first instinct with this data was that I could create some kind of PSA material for Austin residents and visitors, to help raise awareness of the riskier conditions, areas and the times of day/week/year when collisions have historically been more likely.
I put a quick sketch together to work out the kinds of questions I could answer with the fields in our dataset, and how these would all hang together:
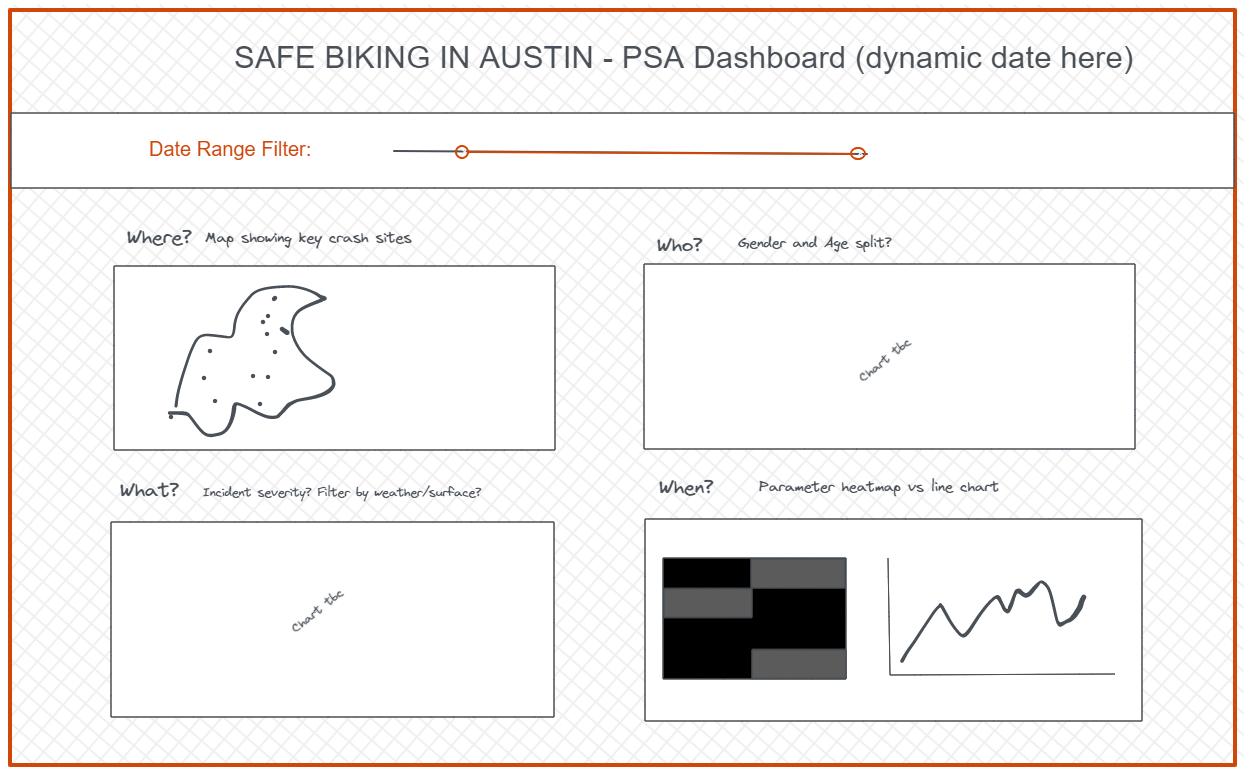
However, I soon realised that the dataset we had included latitude and longitude points for each crash site, but field for 'region', 'street name' or 'neighbourhood', making it harder to make specific comments on which areas in Austin had a more significant history of crashes. It also felt odd including an age and gender split in a PSA dashboard for public users: was I trying to tell the public that they were more at-risk if they were a certain age and gender, and would this be accurate?
While searching for some supplementary spatial data to join onto this dataset, I came across Austin's own 'Biking in Austin' page on the governmental website, including a map of the city split out into which roads were considered more and less appropriate for cycling; they used a 'comfort level' scale to divide up the city roads. This not only provided a great bit of supplementary data, but also made me rethink my user story: I could aim the dashboard not at the public, but at government employees in Austin who would be designing the PSA materials.
An Austin Department for Transportation employee should be able to use this dashboard to explore historical bike crash data and discover any factors that might increase the risk of bike crashes. This would allow them to determine a target audience for PSA materials, as well as key risks to highlight in these materials.
Data preparation:
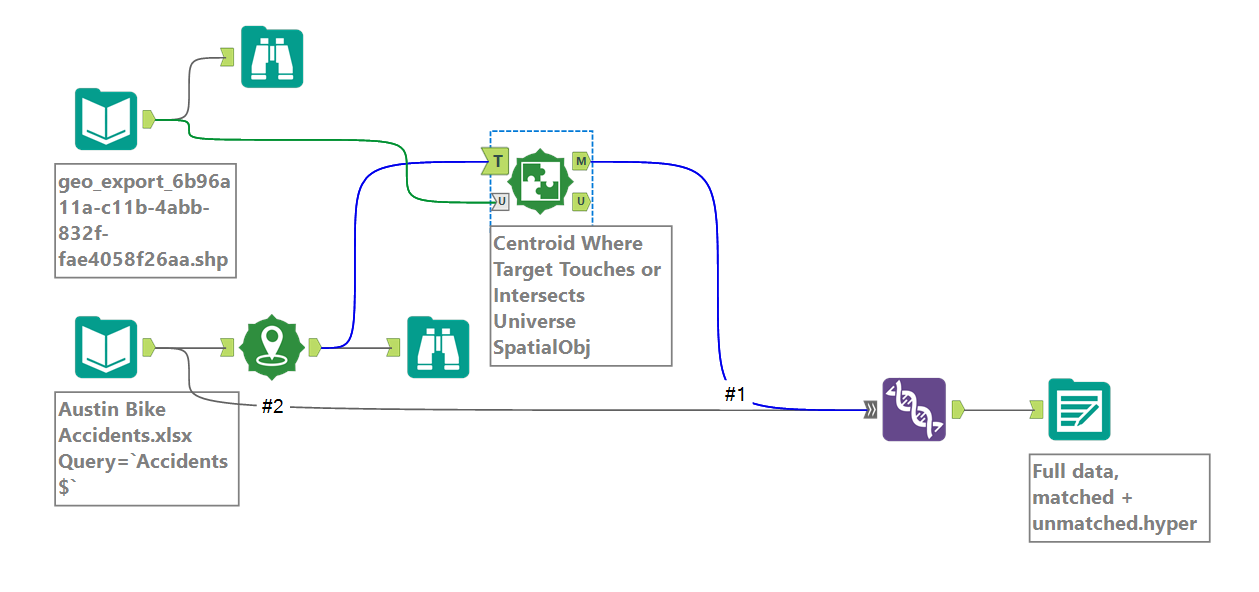
I used Alteryx to bring in the supplementary data about road comfort level scales, as well as some spatial data I could include in a map. I brought in the 'Biking in Austin' data as a shapefile, then used the Create Points tool on our original dataset, and found overlap between roads and crash sites with a Spatial Match tool.
I then used Union to add all spatial data to one long table, whether there had been a crash on that specific road or not.
First draft:
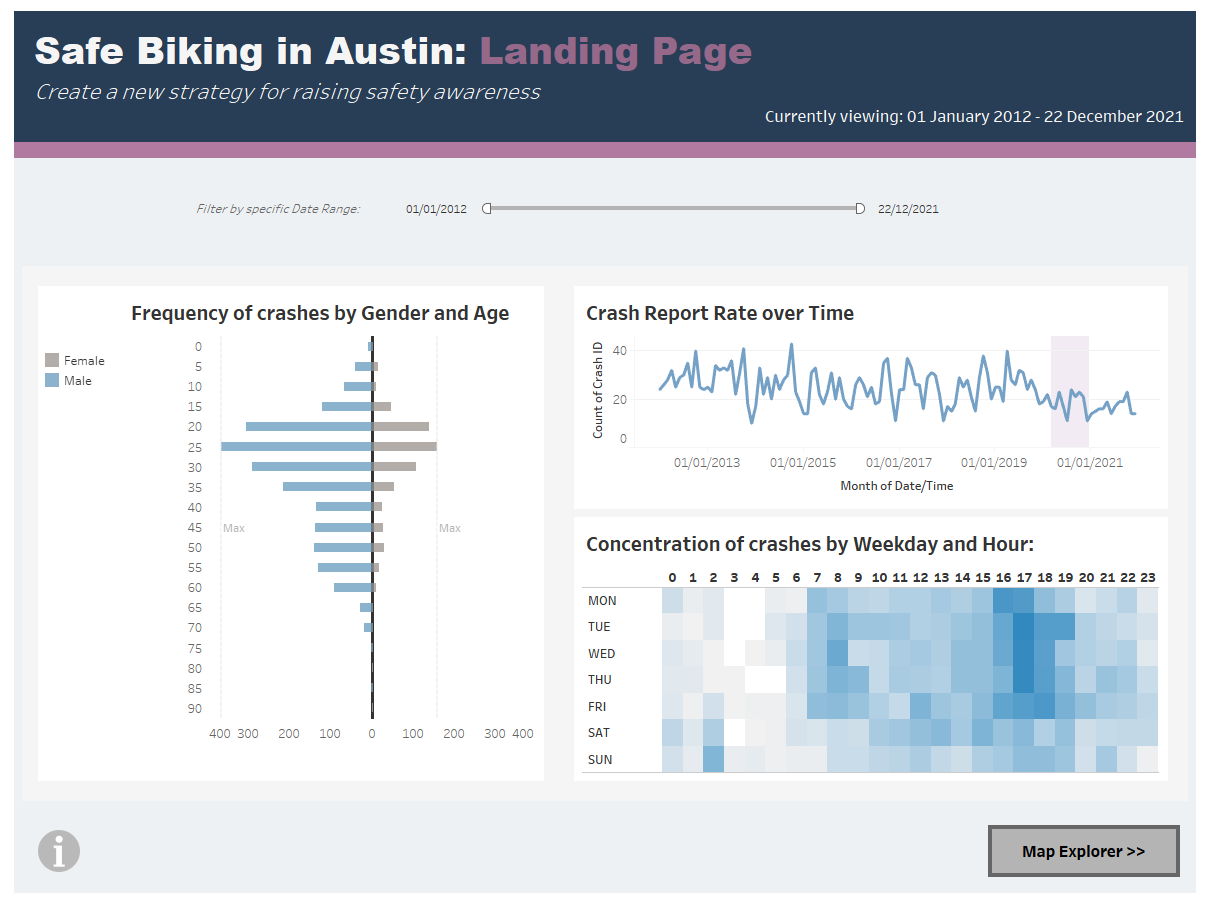
My first iteration was a two-page dashboard with navigation buttons, as below:
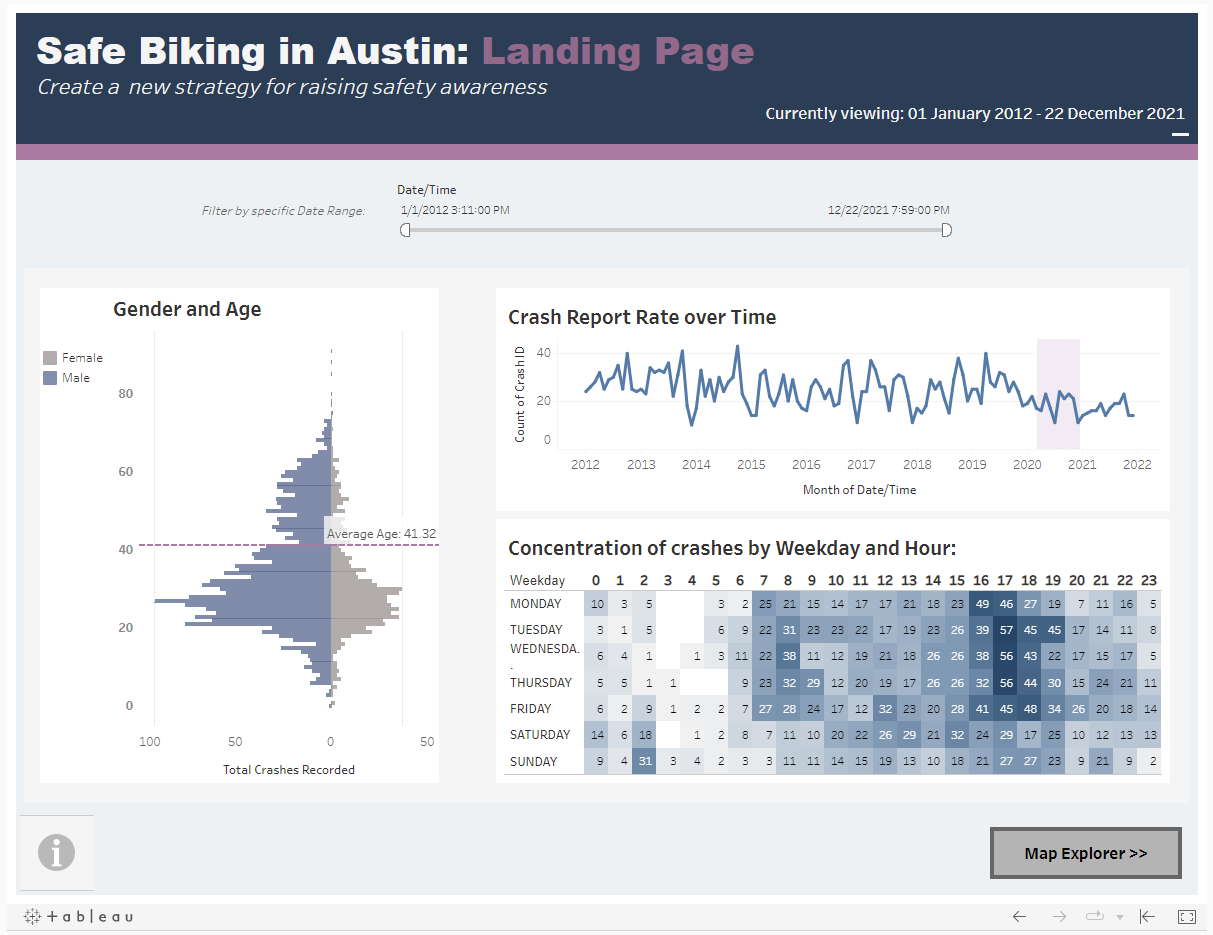
Users could filter the dashboard to a specific time range as desired (with this filter working across both pages); on the Landing Page they could see some demographic information about the age and gender of people involved in crashes, as well as how this rate has changed over time, and how weekday and time of day impact the rate of incidents.
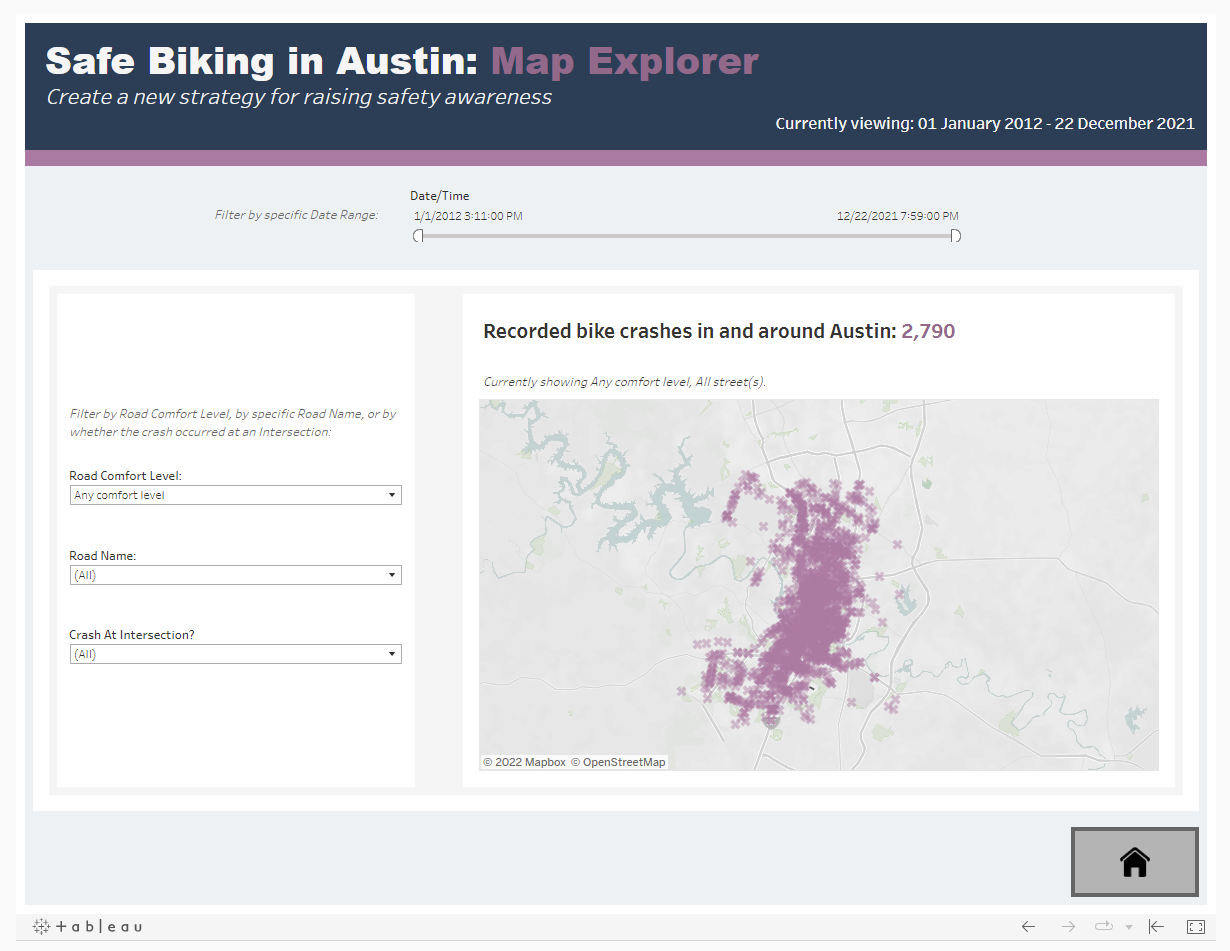
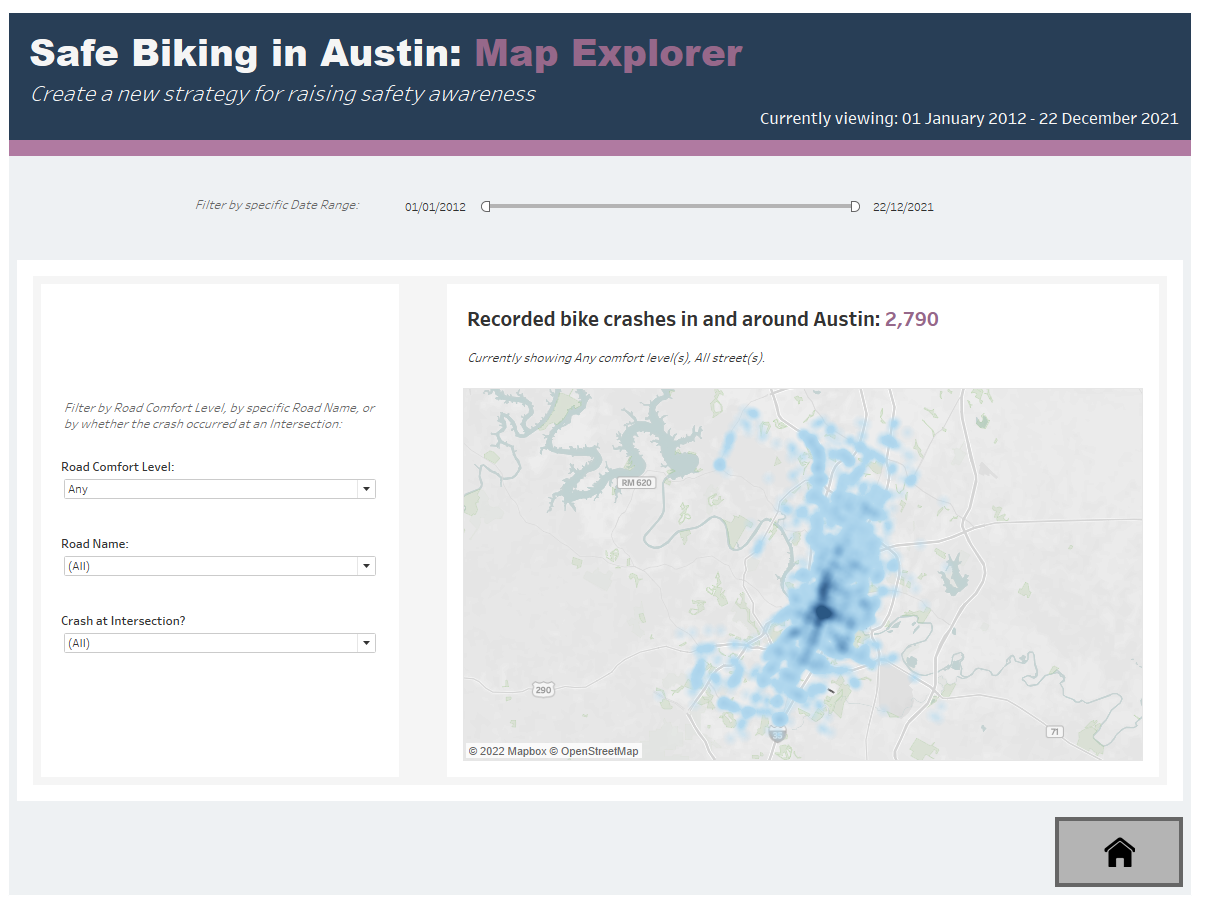
The second page focused on a map of the city with all crash site plotted; users could look at specific road ratings - perhaps to see how accurate these ratings are at predicting danger to cyclists - as well as seeing particular roads, and filtering to only crashes at intersections.
My feedback for this work was fairly positive, but with a number of suggested improvements where more clarity and neatness would be needed.
Reworking the dashboard:
1. I changed the default date format of my filter, since the exact time was unnecessary and cluttered up the dashboard:


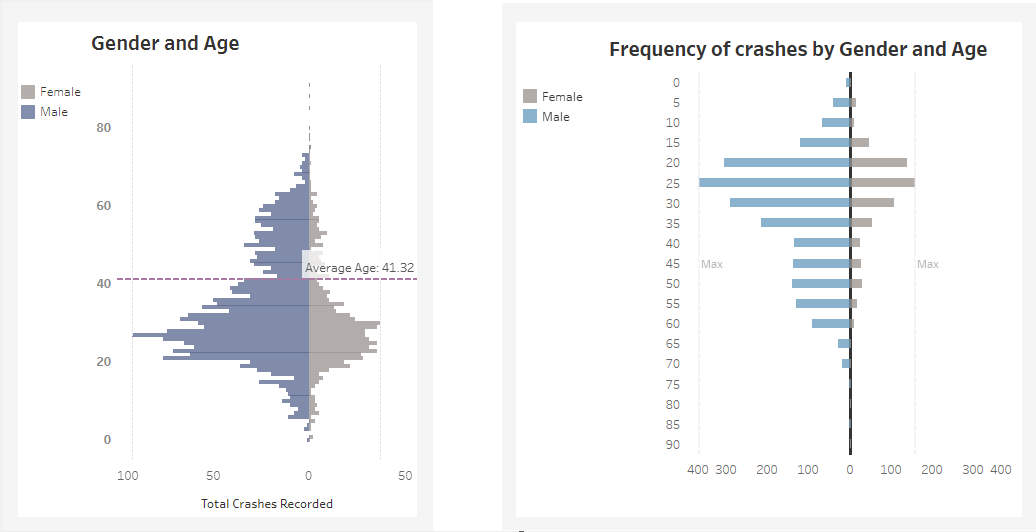
2. I created 5-year bins for the Age field to make my butterfly chart less cramped, flipped it, made the axes symmetrical, and updated the title to be more descriptive:
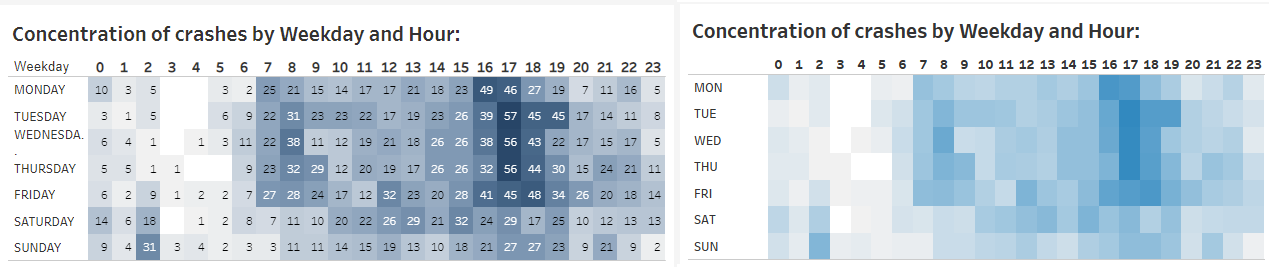
3. I tidied up my highlight chart, setting labels to appear only upon selection, and shortening the weekday names to avoid these wrapping to another row (see Wednesday in the first version):
4. I changed my map marks from Shape to Density, since with an x-shaped marker on every crash site it was difficult to meaningfully comment on where in the city the highest concentration of incidents had been:
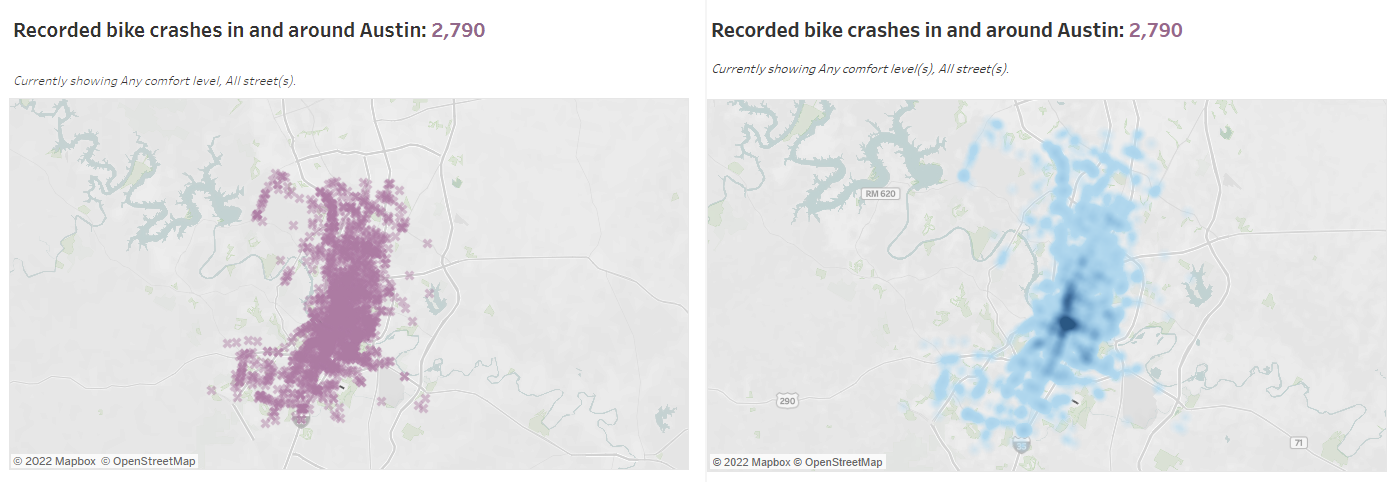
Since density maps have a more limited selection of recommended colour palettes in Tableau, I edited the colour scheme for all of my other charts to complement the new lighter shade of blue used on my map, to make the whole dashboard feel as consistent as possible.
Final result:
The dashboard can be viewed on Tableau Public here.