


Our fourth task in the dashboard week was to visualise the history of songs played by a Spotify user. We got a .json file that could be read directly through Tableau, which eliminated the need for data preparation. However, the instructions of the task mentioned that we could access the Spotify API to gather more detailed and diverse data about the songs. Unfortunately the time was too short to focus on that for now.
Data
The data for this challenge consisted of two .json (JavaScript Object Notation) files. These files were already structured and clean and could be read and directly in Tableau. With a union, the two files were joined and were ready to be analysed.
The Dashboard
Below you can see my dashboard. It has 3 main plots, a bubble chart, a pie char and a heatmap.
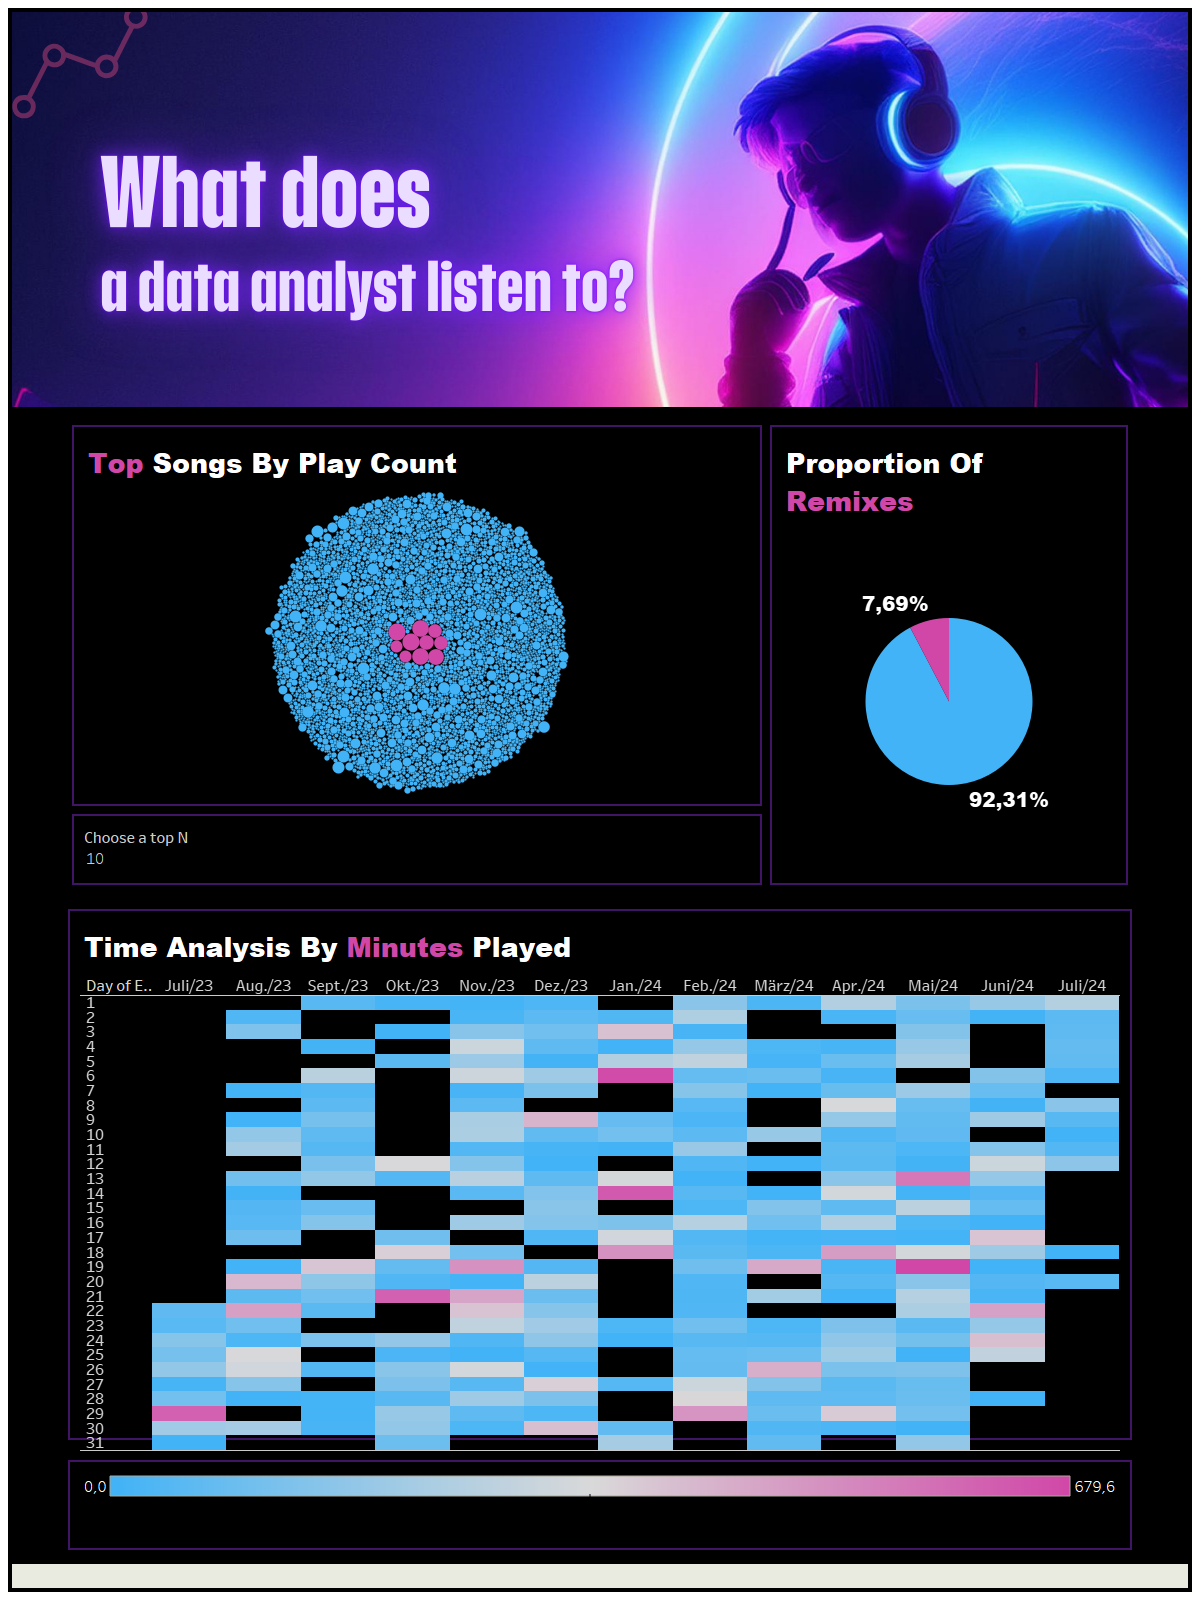
The bubble chart depicts a top N ranking of the songs by play counts. The size of the bubbles is proportional to the amount of times they were played. Pink bubbles represent songs inside the top N group, while light blue ones represent those out of the top ranking. In order to achieve that, I created a set for the song names. The rule of this set was whether a particular song was within the top n group or not, by number of plays. To control "n", I created a parameter.
The pie chart is simply showing the percentage of songs that are remixes from other songs. Finally, the heatmap shows the days and months where the user listened to more songs. Pink represents more time, while light blue represents less time.
Next Steps
- use the pie char as a filter for the other plots;
- fix the color code for the tooltips of the heatmap (they report the time of the day when songs were played - morning, afternoon, evening) because they are conflicting with the color code for the amount of minutes played.