


As a Tableau Consultant, perhaps one of the most important concepts to grasp is the notion of level of detail (LOD). In this post, I will explain what LOD is and what are the three level of details that allow powerful analyses in Tableau.
The term level of detail can have several meanings depending on the context in which the term is used. Below you will find an explanation of each of the three levels of detail.
1.Data level of detail: at your dataset level, it refers to the grain of your data, that is, it is defined by what a single row or record in your data represents. As we are constantly reminded at The Data School, it is essential to know what a single record in a dataset stands for.
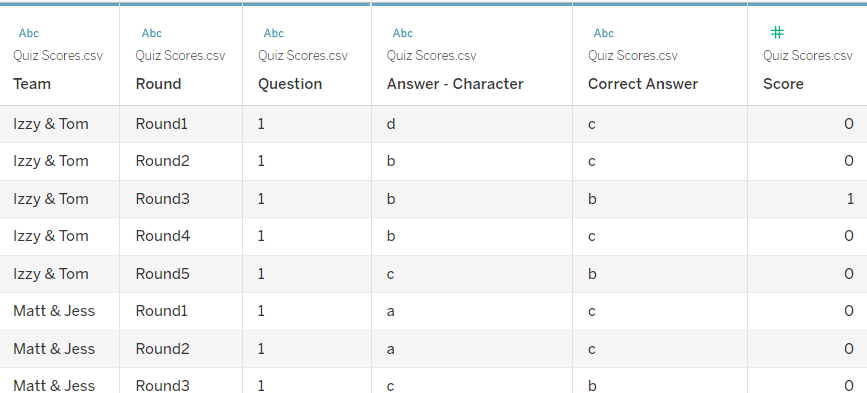
In the table above, for example, the data level of detail is the score for a particular team, round and question.
2.View level of detail: when you prepare a visualisation in Tableau, in a new worksheet, this view will have a particular level of detail that might or might not be the same as the LOD of the data. Usually Tableau generates one mark for each distinct combination of dimensions in a particular view.
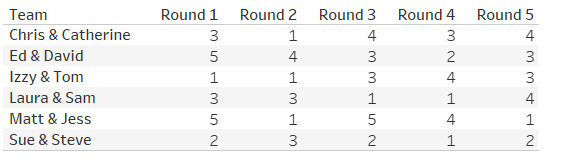
The table above is a Tableau visualisation in a new worksheet. This view had two dimensions (Round and Team) and one measure (Score). Score is aggregated with a sum function by round and team. In this case, we have 30 distinct combinations of team and round and get, therefore, 30 marks. The level of detail, in this case, is sum of score by team and round.
3.Calculated level of detail: when you would like to show two different levels of detail in the same view, then you might need a calculated LOD. This kind of calculation allows the analyst to choose a level of detail to perform a certain aggregation. It can be done with the following function:
{ FIXED [Dimension to group by] : SUM([Measure of Interest]) }
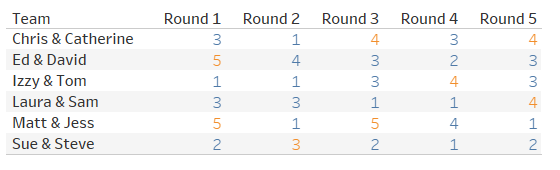
Let us suppose, for example, that we would like to highlight the maximum score of each team by round in the Tableau vis above. If we try to colour the values by a calculated field with MAX([Score]), it will not work because the operation will be executed in the row level (data level of detail). In this case, score can only be 0 or 1 (0 if a particular team, in a particular round got a particular question wrong or 1 otherwise). The maximum value will be, therefore, 1 and will not help us to highlight the maximum values in our view.
To achieve that, we have to use LOD calculations. We need to, first, sum the scores by team and round. This is actually the value we see in each cell of the table.
{FIXED [Round], [Team]: SUM([Score]) }
The second step is to check if the sum above is equal to its maximum value aggregated by team (not by round).
{FIXED [Round], [Team]: SUM([Score]) }
=
{ FIXED [Team]: MAX({FIXED [Round], [Team]: SUM([Score]) })}
This will create a boolean variable that returns TRUE when the value is equal to maximum or FALSE otherwise. Finally, we can colour our table values with this boolean variable.
💡To make the LOD above more readable, we could create two calculated fields:
Score By Team and Round = {FIXED [Round], [Team]: SUM([Score]) }
Max? = [Score By Team and Round]={ FIXED [Team]: MAX([Score By Team and Round])}
Conclusion
You can work with different levels of detail in a single plot. It is essential to identify the LOD of your dataset, of your visualisation and any calculated LOD that you decided to include in your plot. I hope this helps you and have fun learning Tableau!