


The last day of the dashboard week, and also last day of training for DSDE 07, was dedicated to working on our personal project. This project had already been under development during the training and we were free to choose what we would like to work with.
I chose to explain the method I used in my master's thesis through a Tableau dashboard. Basically, in my master's thesis, I studied the effect of two educational policies implemented in a Brazilian state. The objective was to assess whether the new strategies were, in fact, improving student learning.
Another important objective of this personal project is to show other data analysts why this method can matter in data analytics and in bringing value to clients.
The Plan
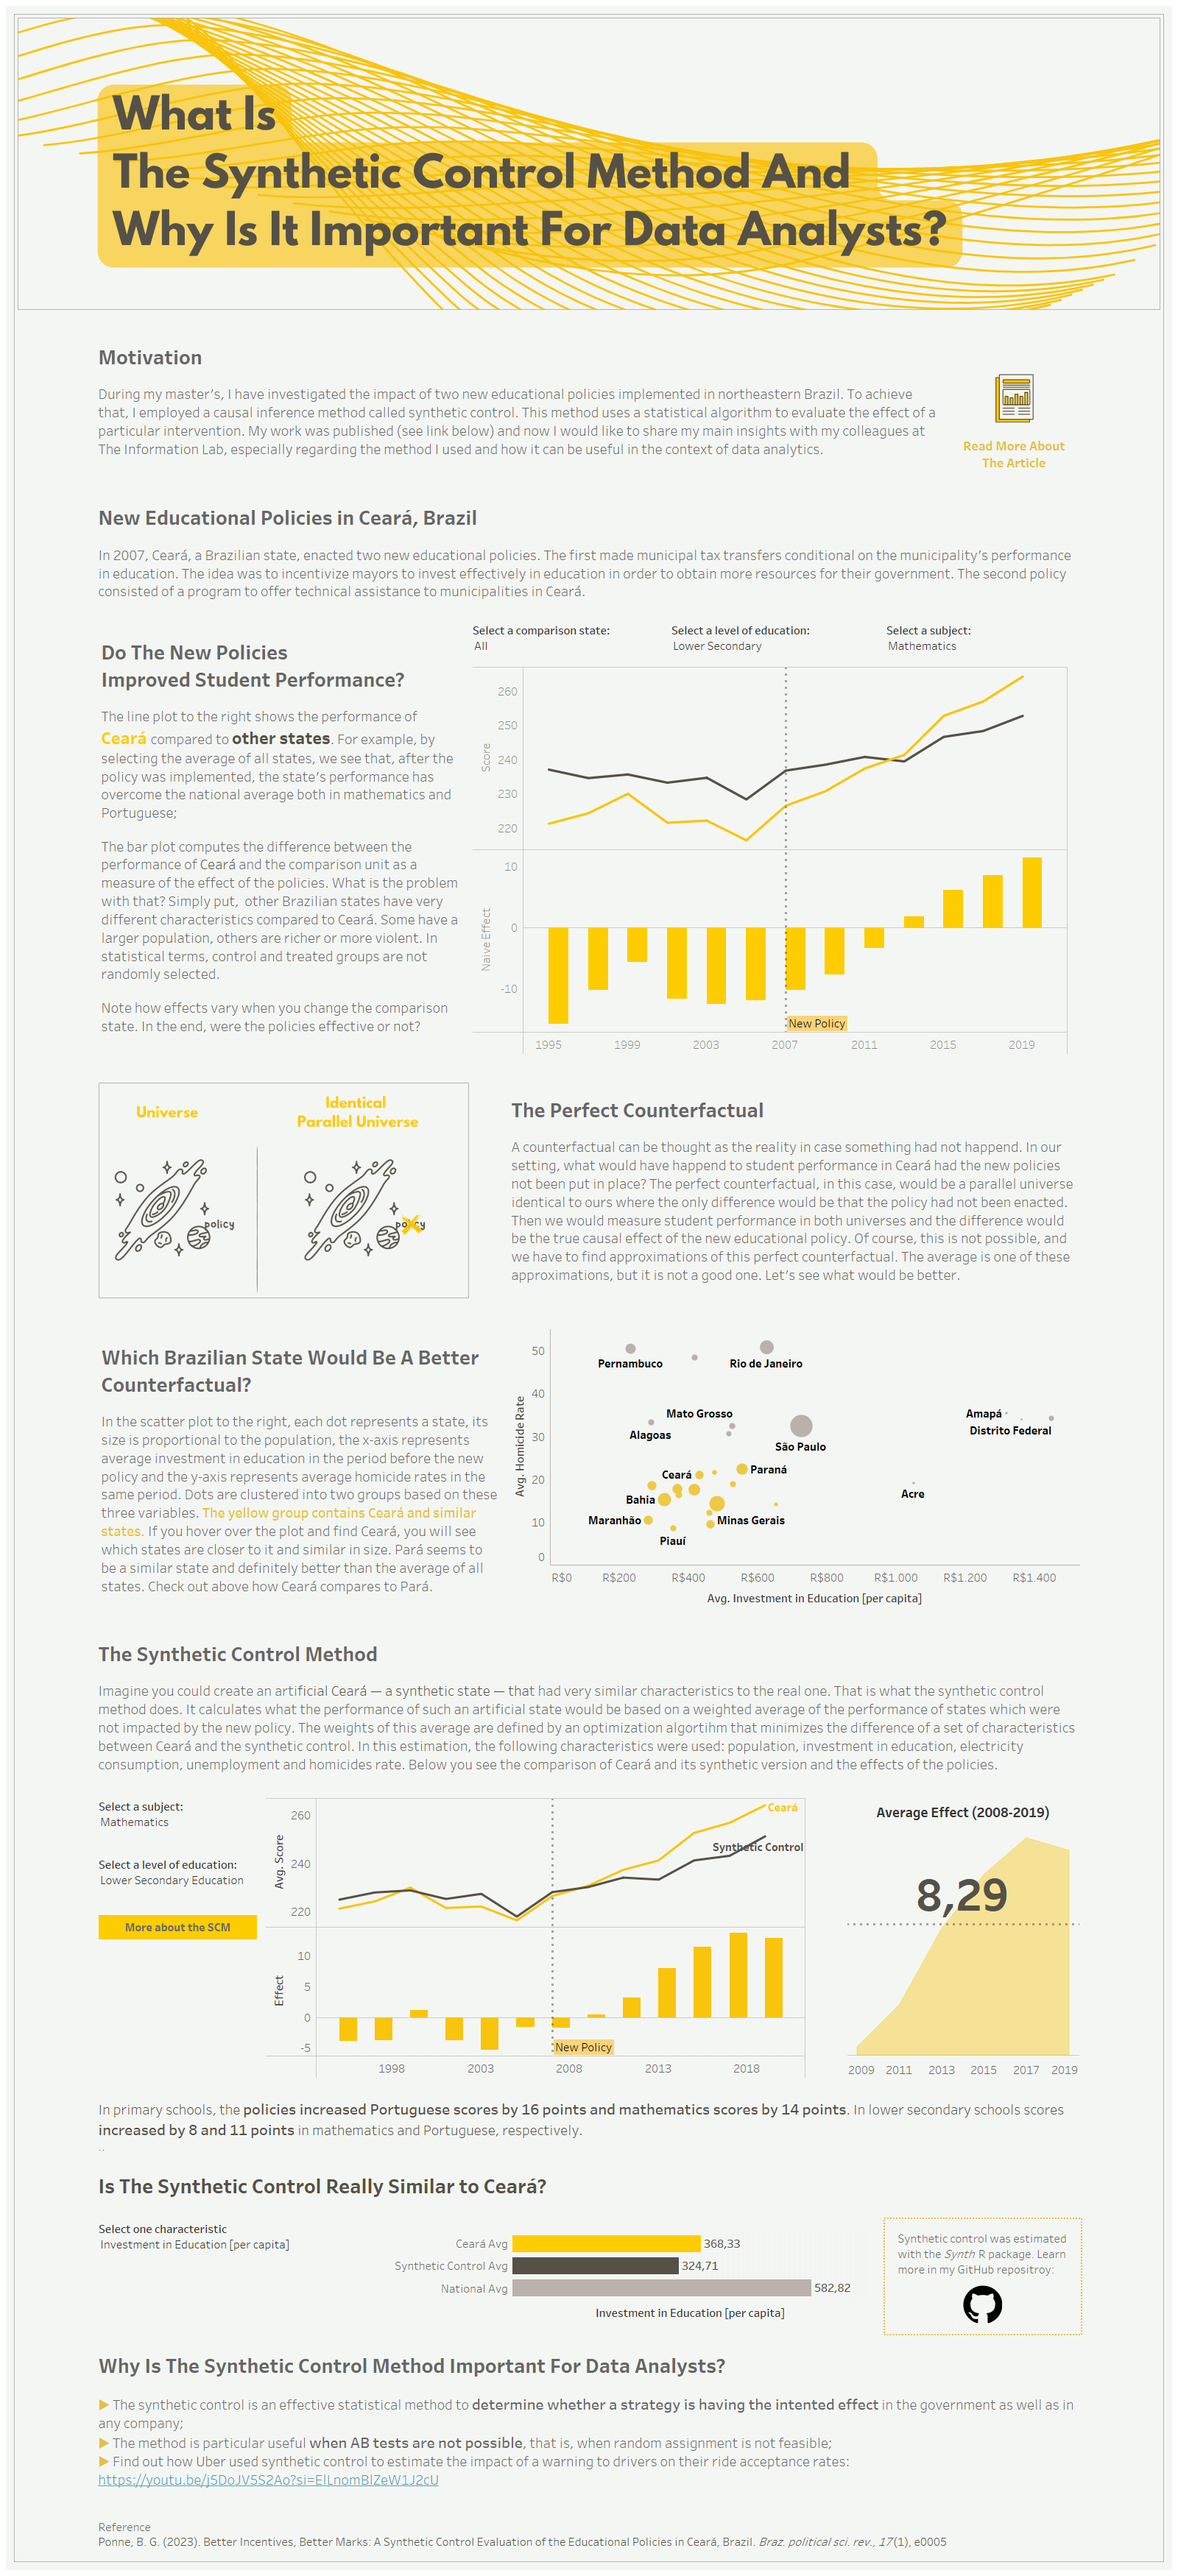
Motivation: In my Master's thesis, I investigated the impact of a new education policy implemented in northeastern Brazil. To achieve this, I employed a causal inference method called synthetic control. This method uses a statistical algorithm to evaluate the effect of the new policy on student performance. My work was published in a Brazilian Journal and I would like to share my main insights with my TIL colleagues, especially regarding the method I used and how it can be useful in the context of data analytics.
User Story: As a data analyst, I like to inform myself about new methods and tools to analyse data. When I want to analyse causal effects in my data, I would like to have a resource that presents causal inference methods in a visual and intuitive way so that I can understand it easily and potentially apply it in my customer projects.
The Result
Link to the dashboard in Tableau Public
My Impressions and Learnings
- It was very challenging to explain a complex method and a subject that I studied deeply for several months in a single dashboard and in a simple and accessible way;
- One of the advantages of my personal project choice was that data was completely ready to be analysed. The datasets were clean and structured.
- During my final presentation, I received valuable feedback that I tried to incorporate into the final version of my dashboard. These were some of the points: summarise in bullet points the main conclusions/take-aways, avoid having too many elements in a small section.
To sum up, the dashboard week was an amazing and challenging opportunity to apply everything that we have learnt over these four months of training. Thanks to all the consultants and coaches who put in all this effort in preparing the tasks and giving us feedback!