


With the new acquisitions for the library at The Data School in Hamburg, I was lucky to be able to choose one of the new books. For a long time, I have heard about the term "Bayesian statistics" but never fully understood what it means and how we can use it to better understand the world.
Because of that, "Bayesian Statistics the Fun Way" by Will Kurt was my choice. It is a great book that introduces Bayesian statistics without requiring advanced math or complex statistical concepts. In this review, I will highlight some of the book's content and share my views on it.
Frequentist vs Bayesian Stats
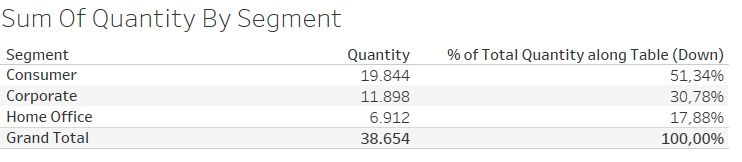
One of the main strengths of this book is its explanation of abstract ideas through accessible examples that illustrate a concept or application. The author begins by demonstrating the difference between frequentist and Bayesian statistics. In frequentist statistics, probability is found by counting how many times an event occurs. For example, in the Sample Superstore dataset, we could find the probability that an item sold is from the Home Office segment by checking the frequency of items in this category relative to the total. Out of 38,654 products, 6,912 are in the Home Office segment. In other words, the probability of a product being in the Home Office segment is around 18%.
In this case, the purchase of a product in the Home Office segment is an event that repeats frequently, and we have a lot of data about it. Imagine an event that does not repeat as often, like the election of candidate A versus candidate B. If we want to calculate the probability that candidate A will win, we do not have a dataset with 10,000 elections in which A ran against B. In this case, Bayesian statistics provides an alternative method to estimate probabilities. But how?
The Bayes Theorem
With Bayes' Theorem, it is possible to update your beliefs about the world based on new data. For example, suppose we believe that candidate A has a 50% chance of winning the election. This is our prior probability, what we believe before new data is available.
One morning, you hear about an attempt to assassinate candidate A and wonder if this might increase his popularity. To assess that, you collect data about past elections and find that there is a 7% chance that a candidate will face a murder attempt. Among the candidates who won, 10% suffered a murder attempt. Among those who lost, 5% suffered a murder attempt. Based on this data, you want to update your beliefs about the election.
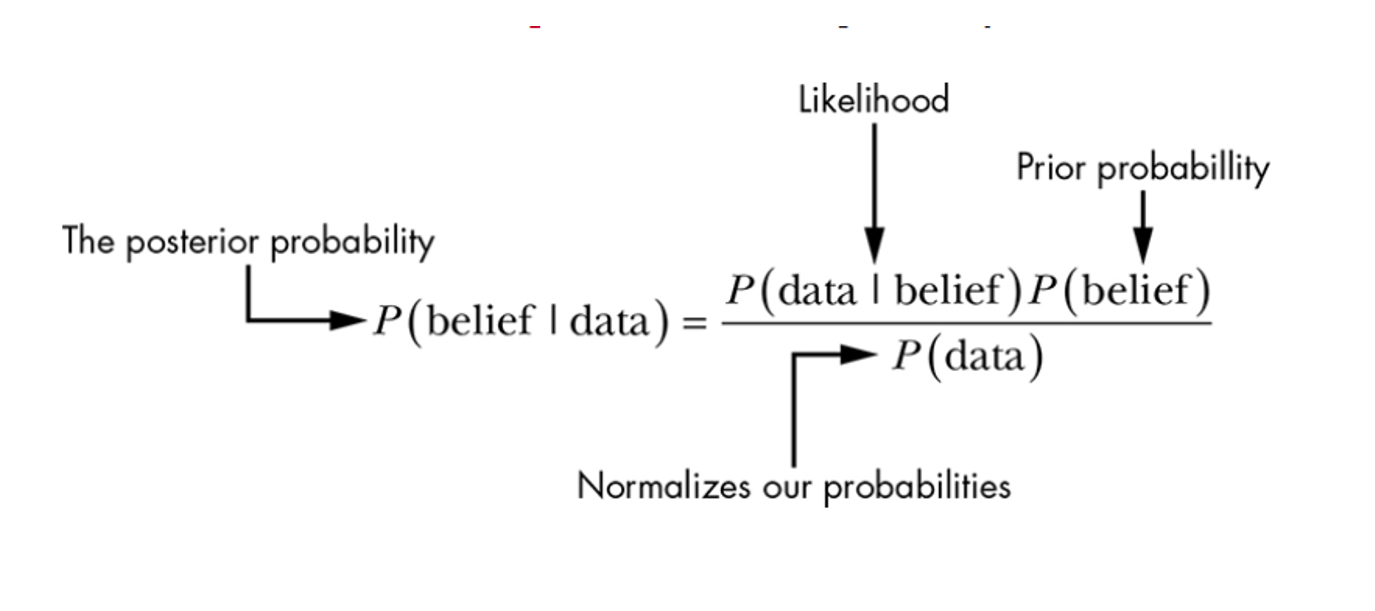
Below, you see Bayes' Theorem. The posterior probability P (belief | data) is what we want to know, i.e., the probability of Candidate A winning given the new data (murder attempt against him). This can be calculated by the P(murder attempt | candidate wins), or the probability of a murder attempt given that the candidate wins times P(candidate wins). This multiplication is then divided by the probability of an attempt happening against an election candidate (independent from the election results)
If we substitute the data in the expression above, we have:
P(Candidate A wins | attempt) = (0.1 x 0.5)/0.07 = 71,4%
Based on the data you observed, Candidate A now has a 71.4% chance of winning the election (instead of 50%). With Bayes' Theorem, you can update your beliefs based on new data.
Parameter Estimation and Hypothesis Testing
After explaining the basics of Bayesian statistics, the author discusses two more complex topics: parameter estimation and hypothesis testing.
Parameter Estimation
When you have only a sample of population data, you might estimate the population parameter based on the sample data. Suppose you received sales data from a company that operates in Europe. Unfortunately, the company only sent you data regarding Italy. Based on this data, could you estimate the average sales for Europe? Yes, and you could define a confidence interval to express the uncertainty of your estimation. This can also be done with Bayesian statistics. Note that in this example, since your sample only includes Italy, it is not a randomly selected sample, which could bias your estimation.
Hypothesis Testing
A final application presented by Will Kurt is hypothesis testing, or A/B testing, as it is known in the business world. A company could, for example, collect data about conversion rates of an email campaign. A conversion could be whether the client clicks the ad or not. The company could be interested in testing two different email designs to see which one performs better. In this case, two hypotheses would be tested. The first is that the design has no influence over conversion rates, while the second is that there is a difference in the conversion rates of the different designs. This is another application of Bayesian statistics.
Opinion and Conclusion
I believe Will Kurt does a great job of introducing the main concepts of Bayesian statistics. I agree with the Amazon review score of 4.5/5 stars for his book. That being said, I would like to highlight some positive and negative aspects.
Positive
- Complex and abstract ideas are applied to concrete cases so that the reader who is not familiar with mathematics and statistics can grasp the basic intuition behind the concepts;
- There are exercises after each chapter, which help you to understand the content;
- The author provides an appendix section where he provides a crash course on R programming language and on Calculus;
- The book revisits basic probability rules for those, like myself, who did not have the best math teachers in High School.
Negative
- Some sections of the book require the reader to have familiarity with R and math. For example, the author uses the beta distribution for several tasks. I had never heard of it before and had to do further research to learn more;
- Some exercises appear to have no correct solution and others are quite advanced to be solved only based on the book content.
I really enjoyed reading this book, and I believe I can now better understand some debates between frequentist and Bayesian statistics. Moreover, the book also helped me better understand basic concepts of statistics that are essential for a data analyst who wants to understand data in a more nuanced way.