


It's Day 3 of Dashboard Week for DSNY 11 at The Data School, and today's challenge was a fun one! We were asked to web scrape The Great British Bake Off''s website using Alteryx and create a dashboard with our cleaned data. As a huge fan of The Great British Bake Off (GBBO), I was excited for this one. I decided focus my analysis on GBBO's summer recipes, which I found through a simple search for "summer" on their website.
The following are the containers from my Alteryx work flow, in sequential order. In the first container, my goal was to generate a link for each page of the summer recipes. Through a simple investigation of their link structure, I found the following pattern:
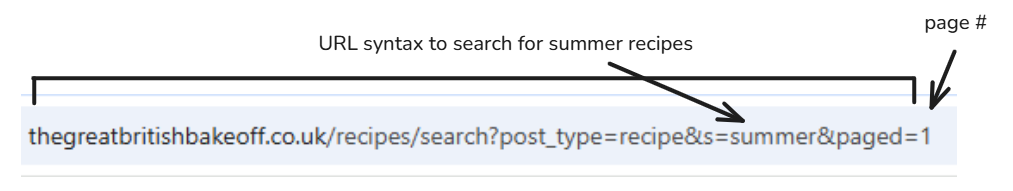
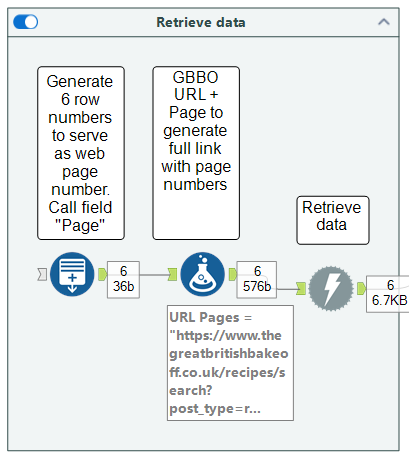
To feed the unique link for each page number into Alteryx, I used the Generate Rows tool to create row numbers from 1-6, called that field Page, and used the Formula tool to perform a simple calculation: URL + Page.
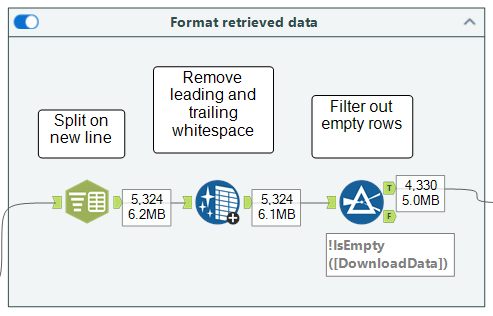
In my second container, I started formatting the web data into a tabular structure by splitting Download Data on each new line (delimiter: \n), removing leading and trailing whitespace, and filtering out empty rows.
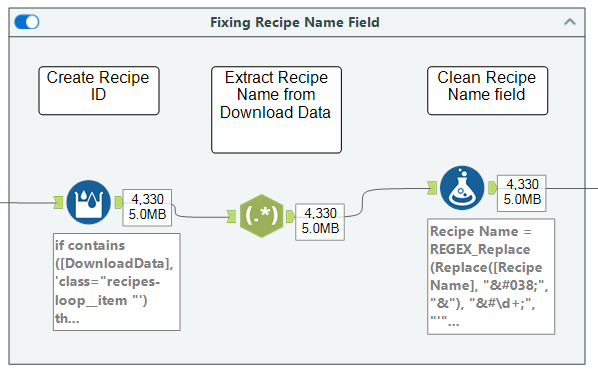
Next, I used the Multi-Row Formula tool to create a new Recipe ID when the Download Data field includes class="recipes-loop__item, which was the HTML source code that started a new recipe. The final step in this container involved using the RegEx and Formula tools to create a Recipe Name field.
Here's a snapshot of my data at this stage:
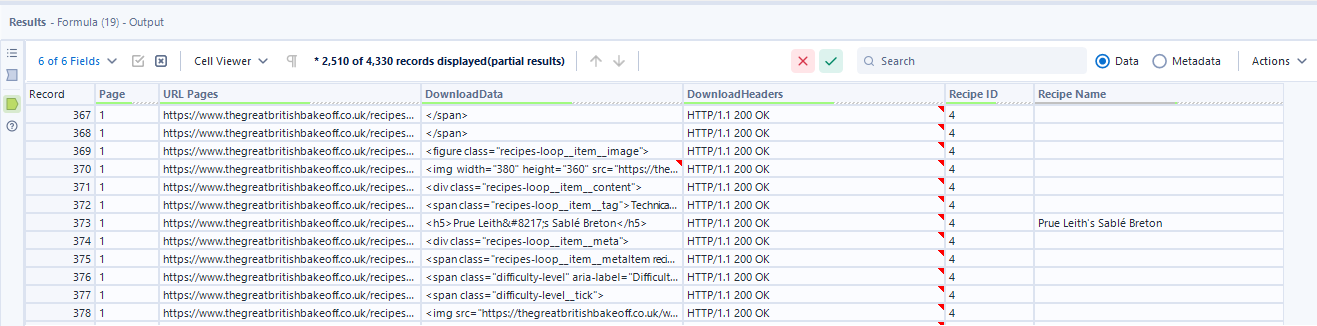
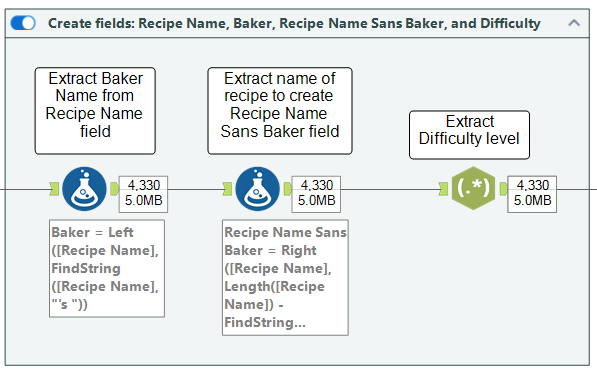
The Recipe Name field is nice to have, but it would be even better to separate the name of the recipe and the baker for analytics purposes. The following container shows how I achieved this using the Formula tool. Lastly, I used the RegEx tool to extract the difficulty level of the bake from the Download Data field, which essentially locates the row in the HTML source code that contains this data.
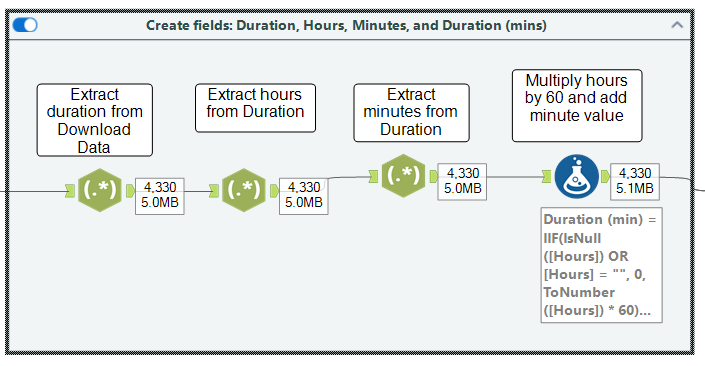
The HTML code also included information about a bake's duration, so I used the RegEx tool again to extract this data and called the field Duration. My job wasn't done here, however, because the durations were listed as strings (e.g., 2 hrs 40 minutes). Having this as a number would strengthen my analysis, so I used RegEx twice to extract the hour and number of minutes from my Duration field. Finally, I used the Formula tool to multiply the number of hours by 60, add this result by the number of minutes, and output the result into a new field called Duration (mins) to get the total number of minutes for any given bake.
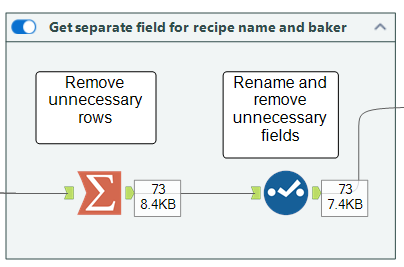
We're almost at the finish line! In this container I used the Summarize tool to group by Recipe ID and take the Max for Recipe Name, Baker, and Duration (mins). This removed all unnecessary (essentially blank) rows and significantly reduced my dataset from over 4,000 rows to 73 rows. This served as a good sense check to show that I was left with one row for each recipe. About 12 recipes per page (remember I was web scraping recipes across 6 pages of GBBO's website).
As a very last step, I outputted my data to an Excel file for use in Tableau.
Check out the final dashboard on my Tableau Public!