


Parameter actions are one of Tableau's most powerful features. In the walkthrough below, I'll explain how you can use parameter actions and calculated fields to tell a story with your data. Whether your goal is to identify high net-worth clients, under- and overperforming products, or patients at risk of hospital readmission, the functionalities used in this chart can be customized to your business context.
- Create scatter plot with Sales on Rows, Profit on Columns, and Product Name on Detail.
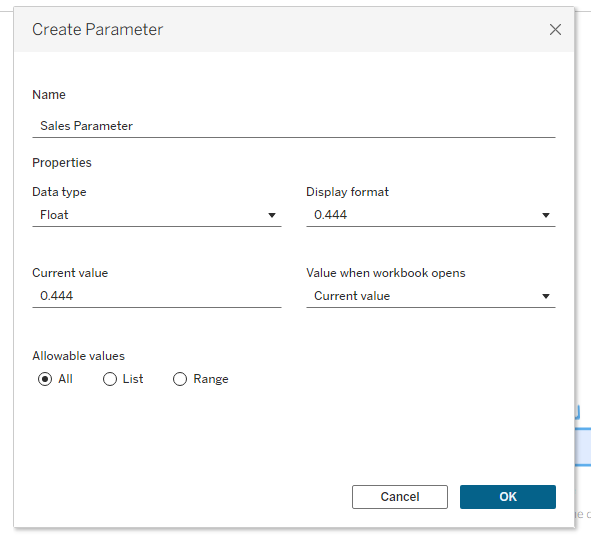
- Create a Sales Parameter, right click on it, and select "Show Parameter."
3.Create a Profit Parameter (with the same settings as the Sales Parameter), right click on it, and select "Show Parameter."
4.Drag a reference line onto just your Sales axis and change the Value of the line to your Sales Parameter:


- Repeat the process for Profit to add a reference line with the Profit Parameter.
- At this stage, you should be able to enter a number in your Sales and Profit Parameter fields and have the reference lines update according to your input. Now we want to add a Worksheet Action in order to be able to click on one dot – a specific product – and have our parameters set to that product's Sales and Profit value. Let's go to Worksheet --> Actions (Ctrl + Shift +A).
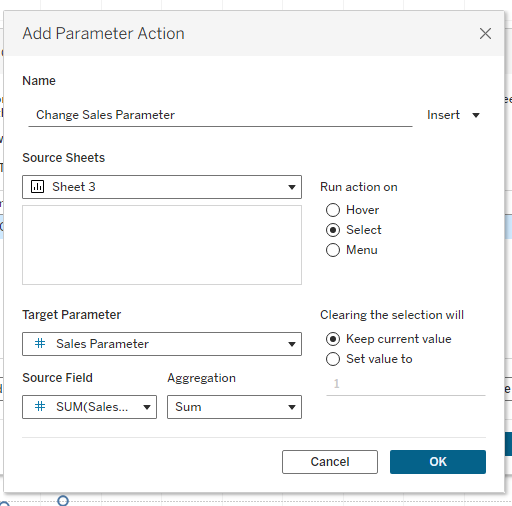
- Create a Parameter Action to update the Sales Parameter whenever you Select a data point.
- Create another Parameter Action targeting your Profit Parameter.
- Let's add some color to this so we can quickly identify the products that are high and low in profit and sales. Create the following Calculated Field:
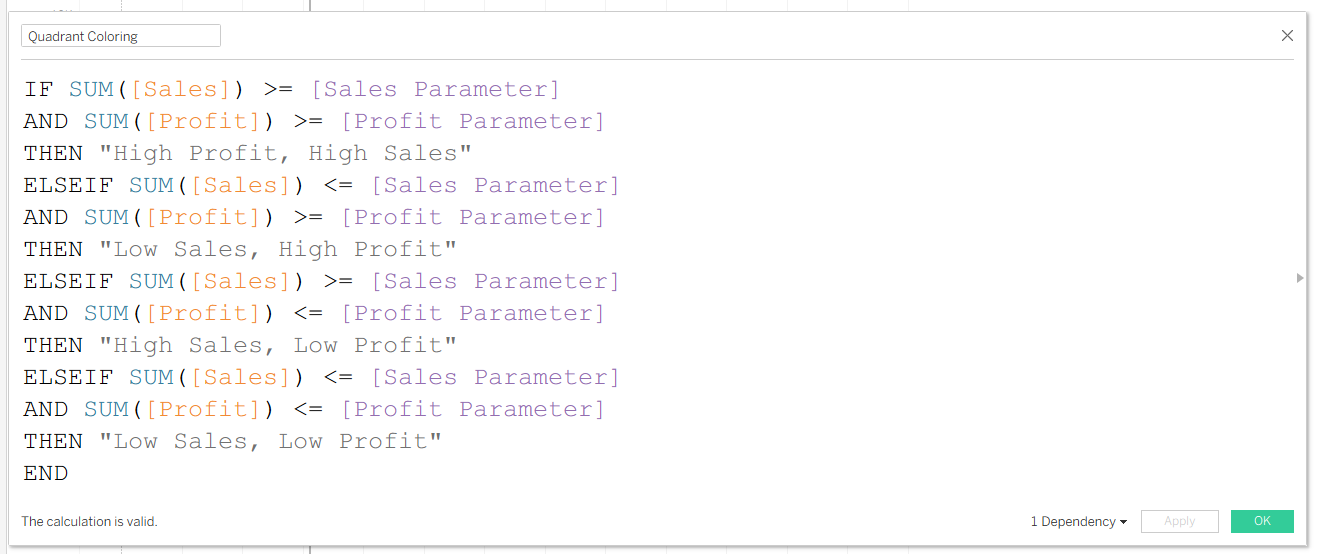
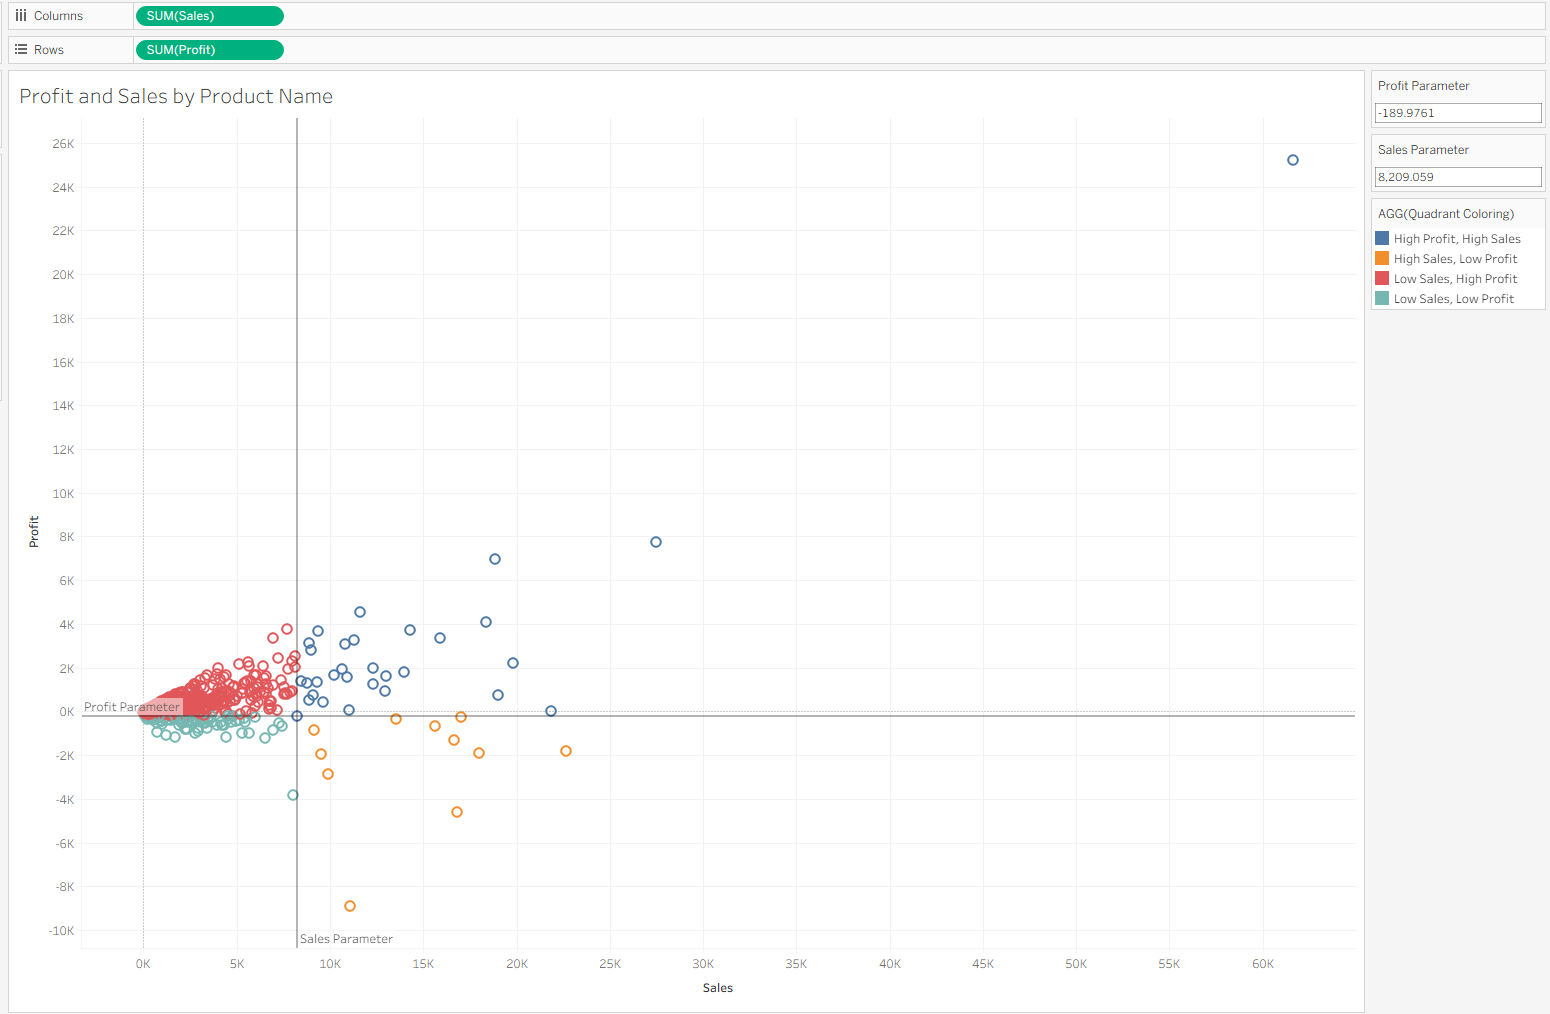
- Drag the Quadrant Coloring Calculated Field onto color and see how the quadrants dynamically update as you click through different products!
If you want to see this drill down in action, check it out on my Tableau Public!