


It's Dashboard Week day 4, and today's challenge was to migrate as much as possible from a Tableau workbook to PowerBI. Our hypothetical client did not have access to the underlying data and was looking for exact replication of functionality, formatting, and layout.
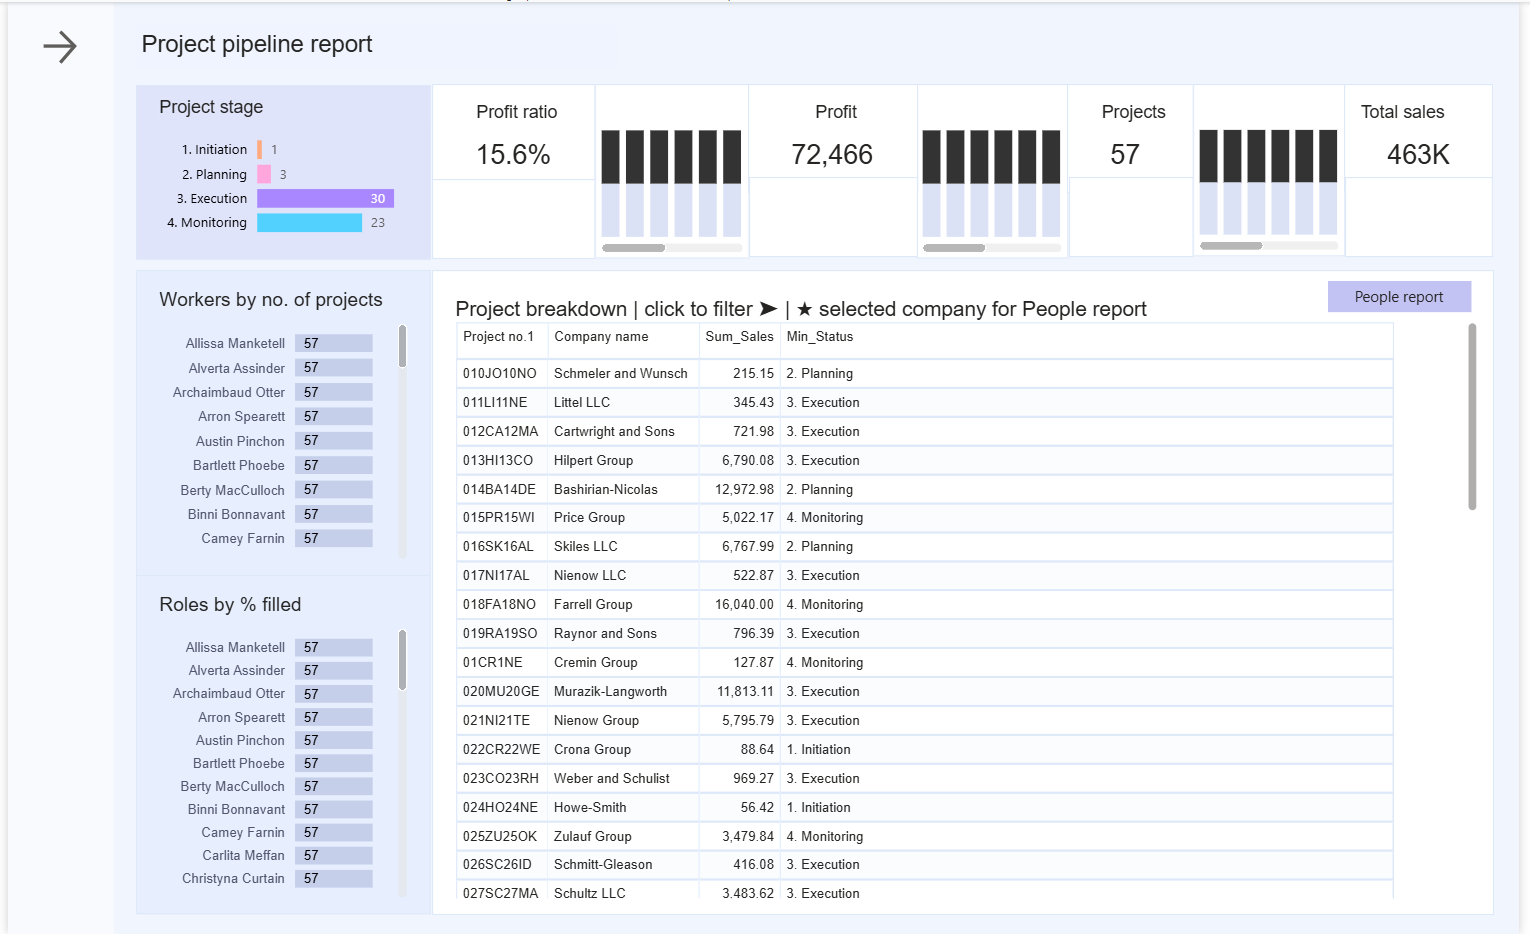
My goal was to replicate as much as possible from Ellen Blackburn's Project Pipeline Report. If you're familiar with Ellen Blackburn's work, it's highly refined, quite complex, and very user friendly. She's especially known for her custom color palettes.
After spending a few minutes being aghast at the request to replicate an Ellen Blackburn piece in just a few hours, I realized this task was probably more focused on managing stakeholder expectations. Given that I felt most adept with simple calculations and formatting in Power BI at this stage, I decided I'd focus my time on reproducing as much of a template for this workbook as possible. That way, when all the correct calculations were made in Dax (PowerBI's language), they could easily be dropped into existing containers without much additional formatting needed. Focusing on my existing skills allowed me to produce a solid amount of work in one day and deliver it confidently.
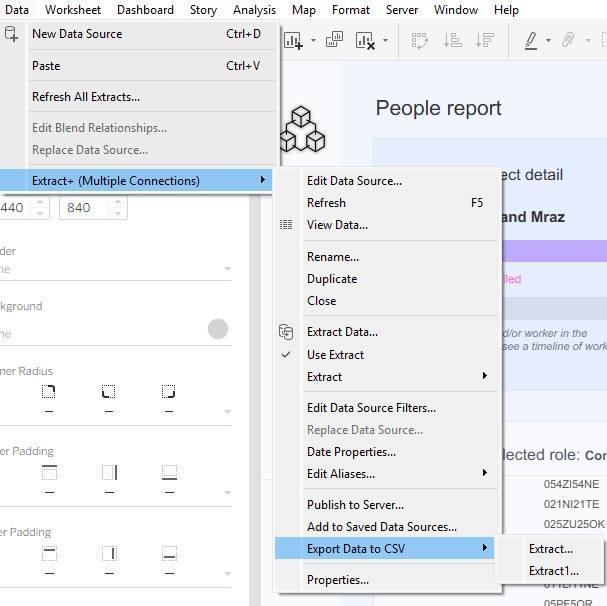
Below, I'll walk through my process for today's task. I started by accessing the underlying data, which I did by downloading Ellen's Tableau workbook and exporting the extracts.
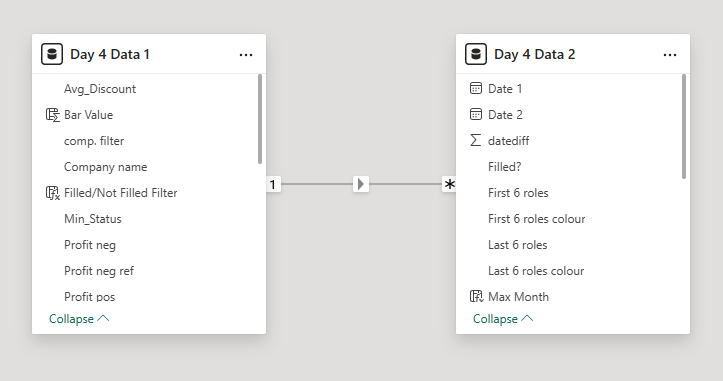
I then fed the data into Power BI and checked that my data model was set up accurately, relating the two tables on Project/Company1.
I then started creating the template by changing the dimensions of the canvas, pulling Ellen's hex codes for background, bar and text colors, and inserting containers according to her placement of charts. Blockers here included (1) navigating a relatively new interface, (2) figuring out why my PowerBI canvas felt smaller despite having the same dimensions as the Tableau dashboard, (3) not knowing how to insert multiple items into a single container so the container border wraps around all elements, and (4) assigning labels the color of their corresponding bar.
The hard part followed after that: migrating the syntax for all of Ellen's calculations (many!) from Tableau to PowerBI. This was one of my major blockers, especially in figuring out Dax formulation of LODs. Not being able to successfully migrate calculations meant that the values in my charts didn't replicate Ellen's, so functionality was inhibited. Knowing that the stakeholder also prioritized replication of layout and formatting, I was pleased to be able to deliver on a portion of their requests in such a short timeframe. Below is what I was able to achieve in one day:
Outstanding steps include doing a lot of research about more detailed formatting in PowerBI and Dax formulation. Seeing Ellen's extensive work on the back end was certainly valuable and gave me more appreciation for the beautiful pieces she creates with data.