


In today's data-driven world, efficient data modelling is critical to making informed decisions. Lookup tables play a vital role in achieving this by providing a streamlined way to manage and analyse data. They not only help in organising information but also ensure accuracy and consistency across various reports and dashboards.
What are Lookup Tables?
A lookup table is like a dictionary for your data. Imagine having a table that lists all your customers with unique IDs. Instead of storing customer details repeatedly in every sales transaction, you use this table to reference them efficiently. This not only saves space but also ensures that any update to customer details is reflected everywhere instantly.
Benefits of Using a Lookup Tables in Power BI
1. Organise Your Data
- Structured Environment: Lookup tables help categorise data into different dimensions, providing a clear structure for easy access and interpretation.
- Example: In a retail business, a region lookup table organises sales data by geographic areas, simplifying the analysis of regional sales performance.
2. Reduce Redundancy
- Centralised Information: Lookup tables minimise data duplication by storing common information separately, reducing storage needs and simplifying updates.
- Example: Instead of repeating customer details in each sales transaction, a customer lookup table stores this information once, with the sales fact table referencing it through unique identifiers.

3. Ensure Consistency Across Reports
- Standardised Definitions: Lookup tables ensure consistent data interpretation by standardising data definitions and relationships across reports.
- Example: A product lookup table that defines product categories ensures consistent categorisation in all reports, leading to accurate comparisons and aggregations.

How Lookup Tables Solve Everyday Data Challenges
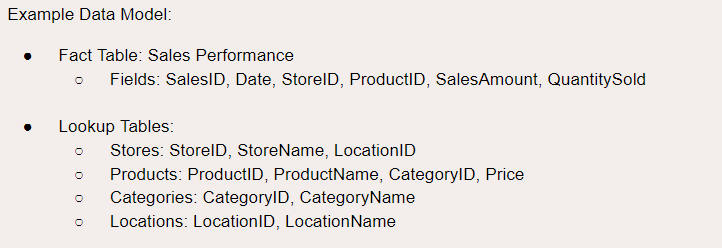
Usecase 1 : Our first use case is for a Retail Manager analysing sales performance. Imagine you have sales data across multiple regions and product categories.
By creating lookup tables for Products, Regions, and Salespersons, you can link sales transactions to specific products and regions. This enables the manager to generate detailed reports showing total sales by region, top-performing products, and salesperson performance, helping to identify trends and make informed decisions.
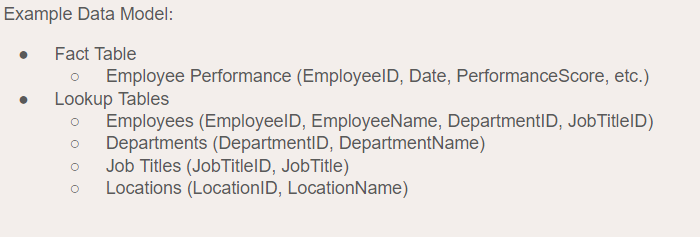
Usecase 2 : Next, let's consider an HR Manager tasked with analysing employee performance. In a large organisation, tracking performance across departments and job roles can be complex.
By using lookup tables for Employees, Departments, Job Titles, and Locations, the HR Manager can link performance data to individual employees and their respective departments. This facilitates detailed analysis, such as comparing performance across departments, identifying training needs, and managing talent effectively.
How to create a Look up Table in Power BI
Step 1: Import your data into Power BI
- Open Power BI Desktop
- Get Data: Import data from your source (Excel, SQL, online services, etc.)
- Load Data into Power BI
Step 2: Create a New Table
- Switch to Data View
- Create Table: Click Table Tools > New Table
- Define Table: Use DAX to define your lookup table
- Example: ProductCategoryLookup = DISTINCT('Sales'[ProductCategory])
Step 3: Add Data to Lookup Table
- Manual Entry: Use Home > Enter Data for static tables
- Dynamic Table: Use DAX for dynamic tables
- Example: DateLookup = CALENDAR(MIN('Sales'[OrderDate]), MAX('Sales'[OrderDate]))
Step 4: Create Relationships
- Switch to Model View
- Create Relationship: Drag fields between tables or use Manage Relationships
- Configure: Ensure one-to-many relationship between lookup and fact table
Step 5: Use Lookup Table in Visuals
- Switch to Report View
- Create Visuals: Drag fields from lookup table to visuals
Types of relationships between facts and look up tables
To create effective data models in Power BI, it is vital to understand the relationships between fact and lookup tables, ensuring accurate analysis and meaningful reporting.
- One-to-One (1:1) : Each record in the fact table is related to one record in the lookup table, and vice versa. This is less common.

- One-to-many (1) A single record in the lookup table is related to multiple records in the fact table. This is the most common relationship.

- Many-to-one (M:1): Multiple records in the fact table relate to a single record in the lookup table. This is essentially the same as one-to-many, just viewed from the opposite direction.

In conclusion, lookup tables are essential for efficient data modelling, providing organisation and consistency in reports. They reduce redundancy by centralising information, as demonstrated in retail scenarios where sales data links to products and regions, and HR cases where employee performance is analysed by departments and job roles. Mastering lookup tables in Power BI is crucial for optimising data insights and reporting in Power BI!