


Firstly, what are containers?
Containers are dashboard objects such as text, images, sheets, filters, legends) that enable developers to neatly create, map out and organized your sheets onto your dashboard.
There are two types of containers:
- Horizontal containers allow you to move objects objects to the left or right of each object.
- Vertical containers: allow you to place an object above or below
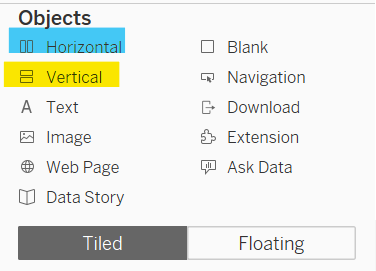
Key tip 1 : Once you've dragged in your horizontal or vertical container always drag a blank object in. This helps to align and space out your objects more effectively.
Key tip 2: Using Tiled objects rather then floating objects helps you to keep objects in place without having to manually change size. Also, when publishing your dashboard tiled containers helps you to place objects permanently and prevent them from floating around.

Creating a sketch on excalidraw (highly recommend) helps to map out where you want to place objects such as your title, graphs and logo before putting them onto your dashboard.

Key takeaway from containers is to always used tiled instead of floating to allow you to easily manipulate your dashboard without having to focus on the measurements of each individual object(unless specified), this saves a lot of time and allows you to focus on more important aspects of your dashboard.