


A live data source allows you to access real-time updates, with when it was last updates made in tableau.
- Make sure your database is live.. this can be checked by looking out for a blue tick next to the cylinders.
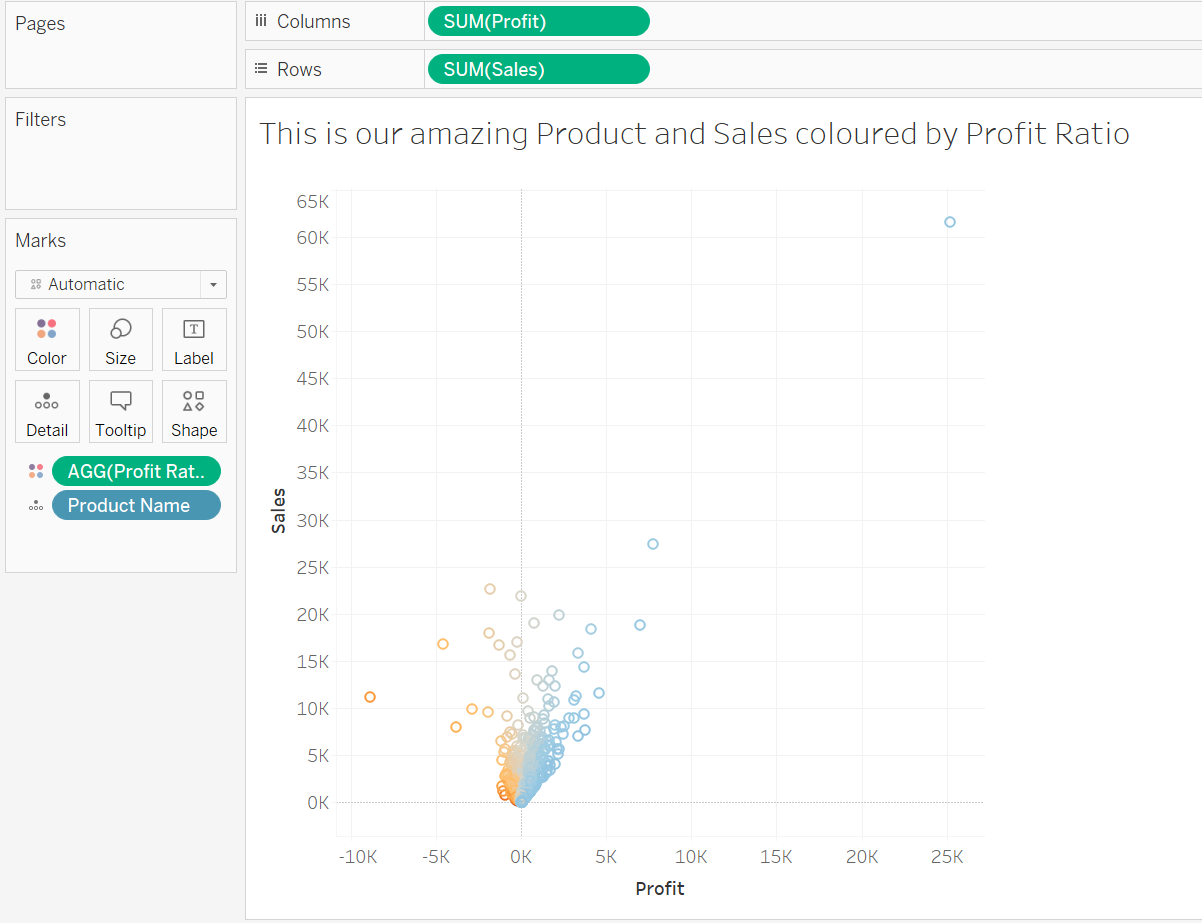
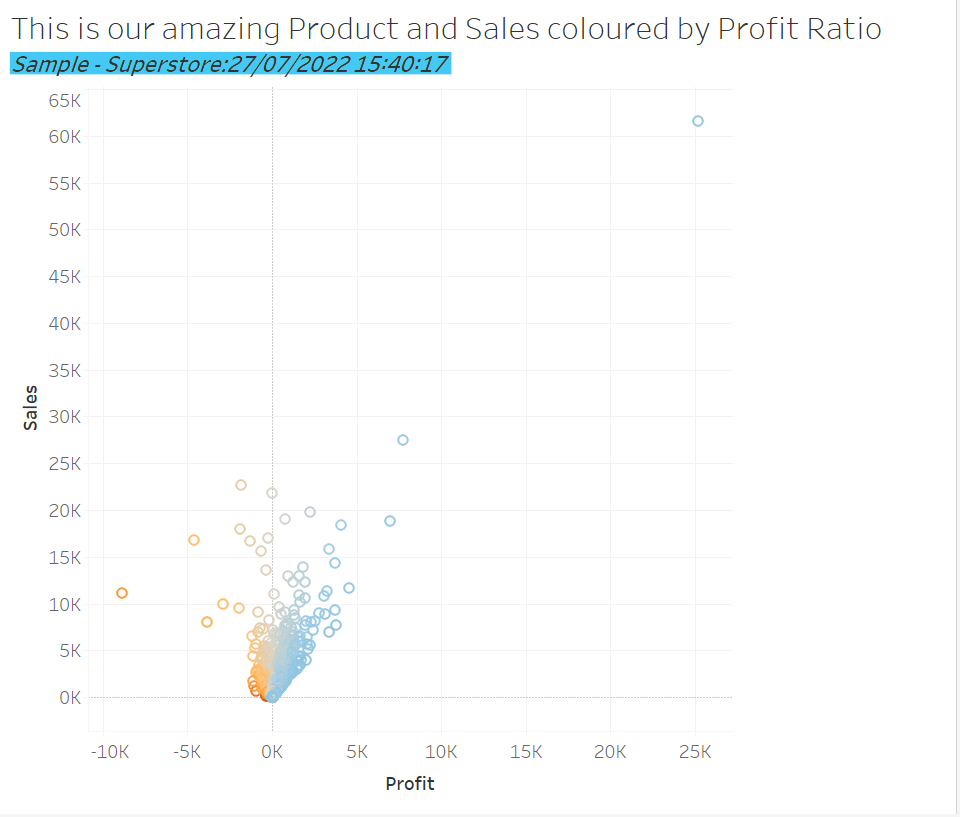
2. Create your graph ( in this case we're looking at the profit ratio against product and sales.
3. To create your data source time, open up your title and click on to insert. Then select 'Data Source name' and insert a colon ':'
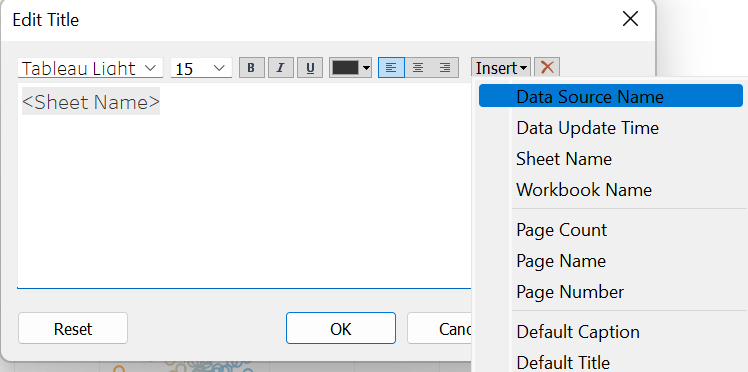
4. After the colon, click insert again and select 'Data Update Time'.
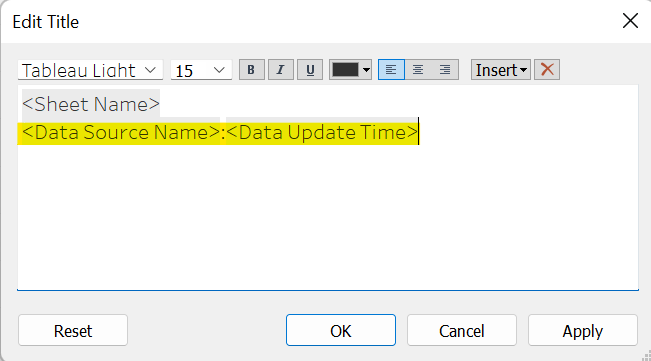
5. Click Apply and now the '<Data Source Name:Date Update Time>' will appear underneath the title showing the name of sheet and the date and time it was last updated as seen highlighted below.
Now you can easily see when the worksheet has been refreshed.