


This tutorial uses Tableau's sample dataset, Superstore. For instructions on how to access this dataset, please see this guide.
In Tableau, creating a dynamic "Top N" filter allows users to control how many top items (e.g., customers, products, categories) they want to display on a dashboard. Here's a step-by-step guide to create it:
1. Build the Base Chart
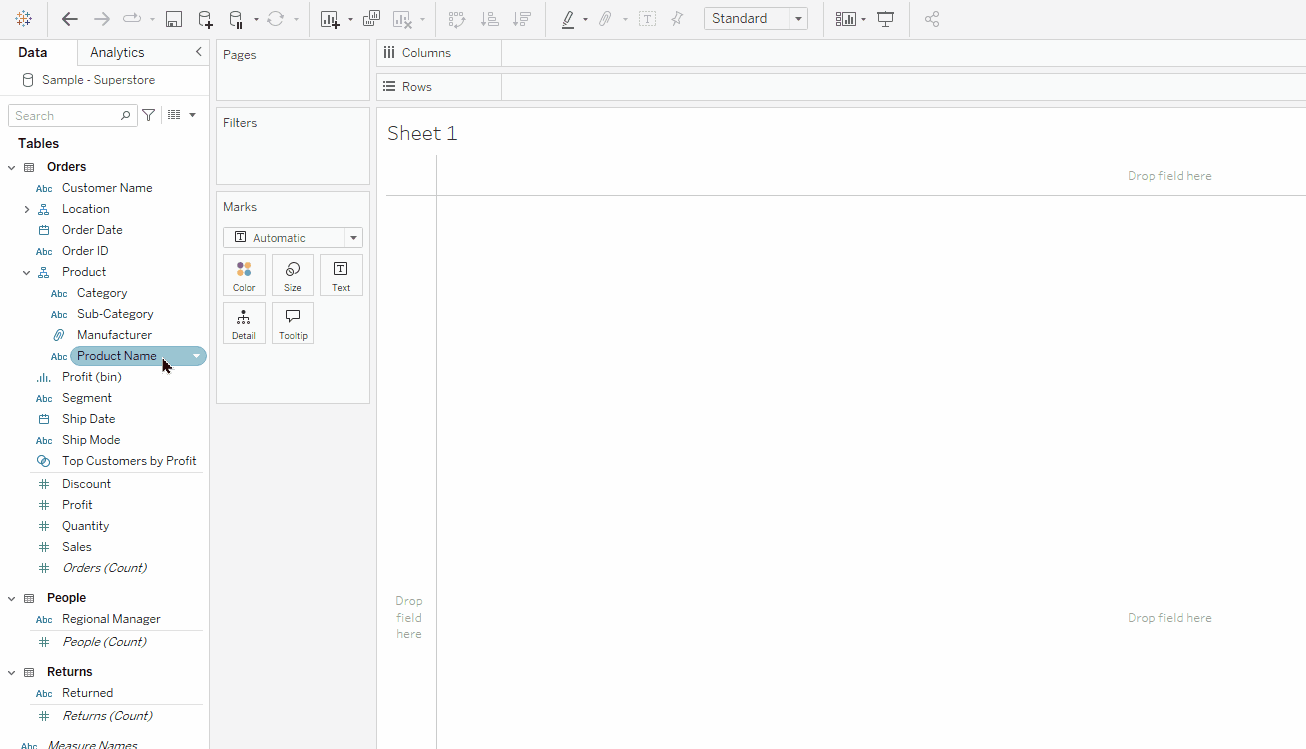
- Drag the
Product Namepill to Rows. - Drag the
Salespill to Columns.
2. Create Parameter
- In the Data pane, click the drop-down arrow in the upper-right corner and select Create Parameter.
- In the Create Parameter dialog box:
- Set the Name to
Top N Parameter. - Set the Data type to Integer.
- Set the Current Value to
5(this can be adjusted later). - Under Allowable values, select All.
- Click the OK button.
- Set the Name to
3. Show the Parameter Control
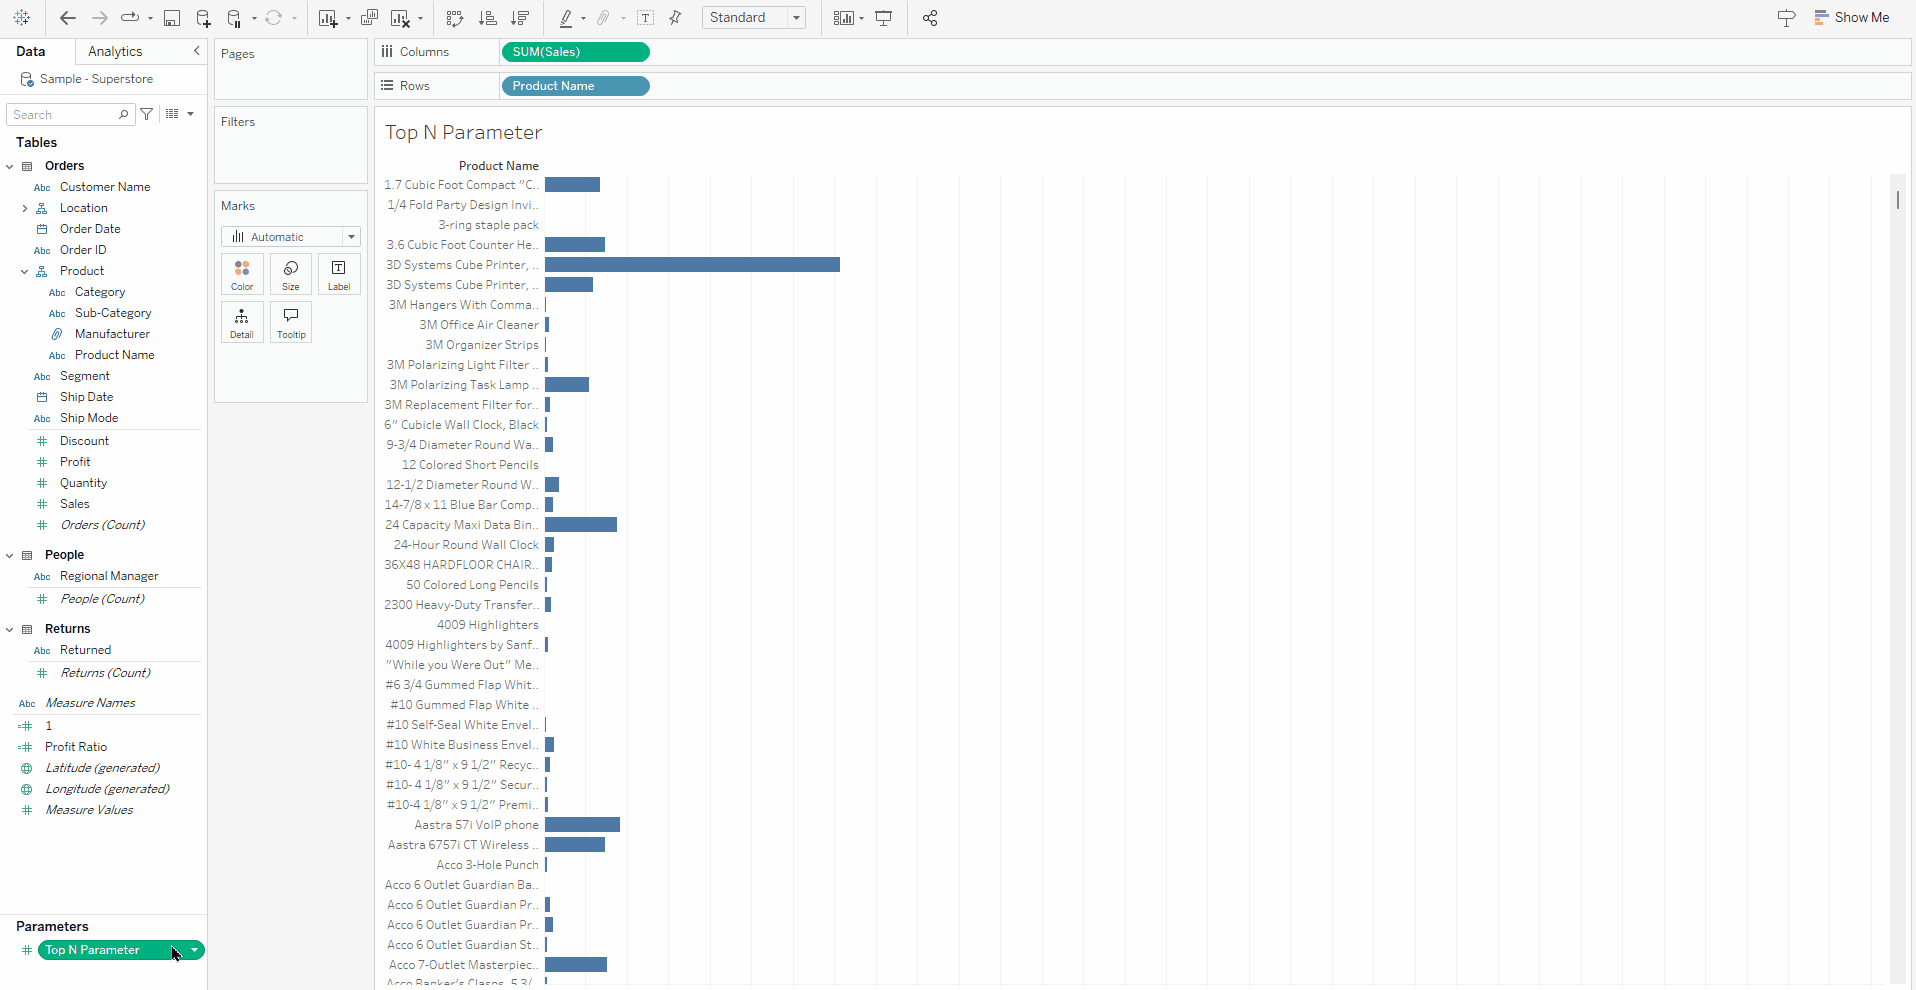
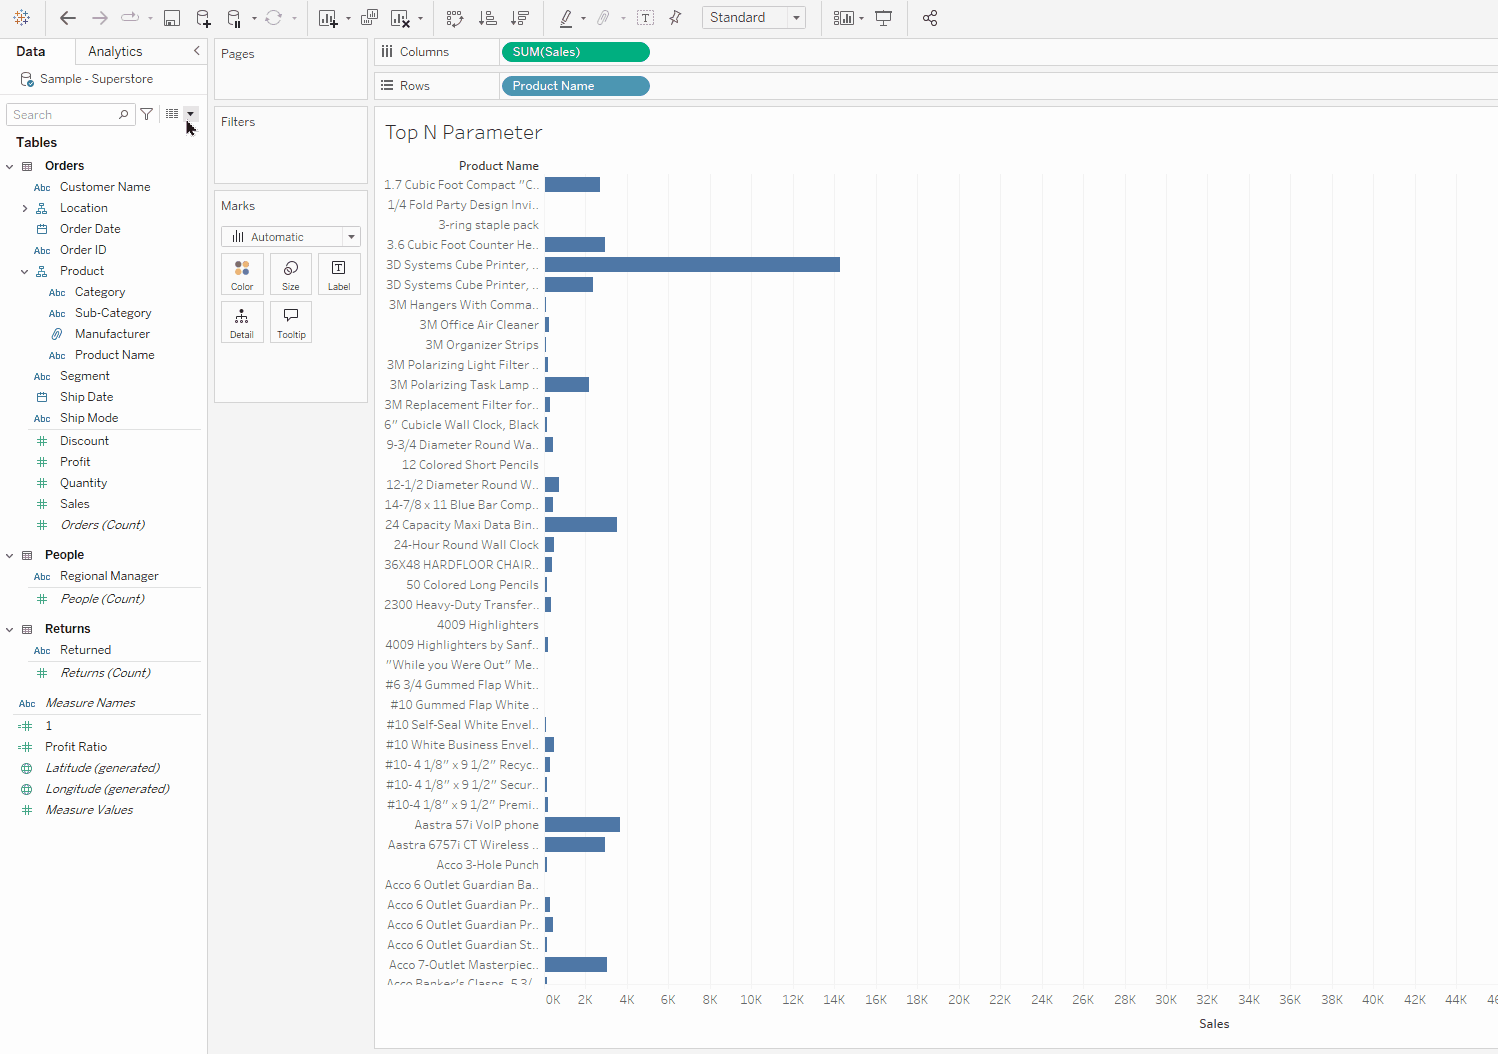
- In the Data pane, right-click on
Top N Parameter(found at the bottom under Parameters) and select Show Parameter. This allows you to control the value dynamically.
4. Create the Filter
- Drag the
Product Namepill to the Filters shelf. - In the Filter dialog box:
- Go to the Top tab.
- Select By Field.
- Set the dropdowns to:
- Top by
Top N Parameterusing Sales (Sum).
- Top by
- Click the OK button.
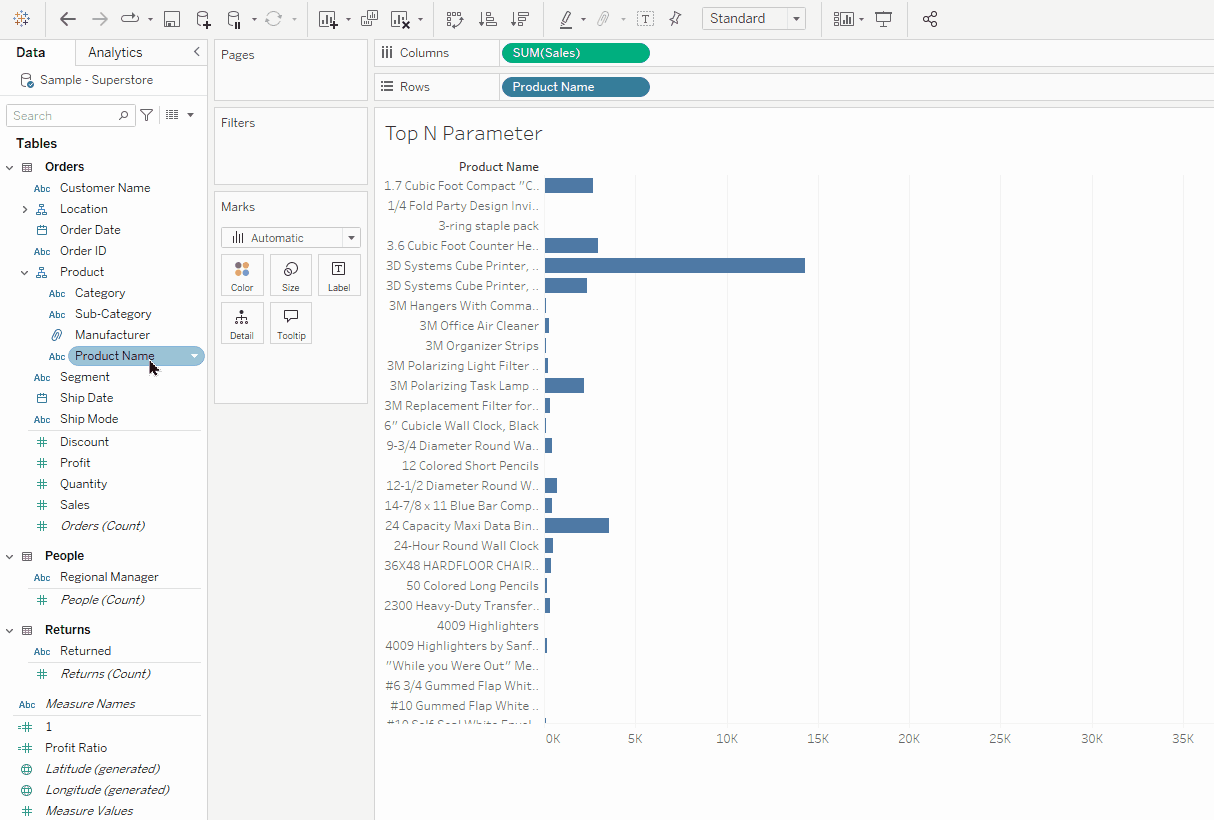
5. Test the Parameter
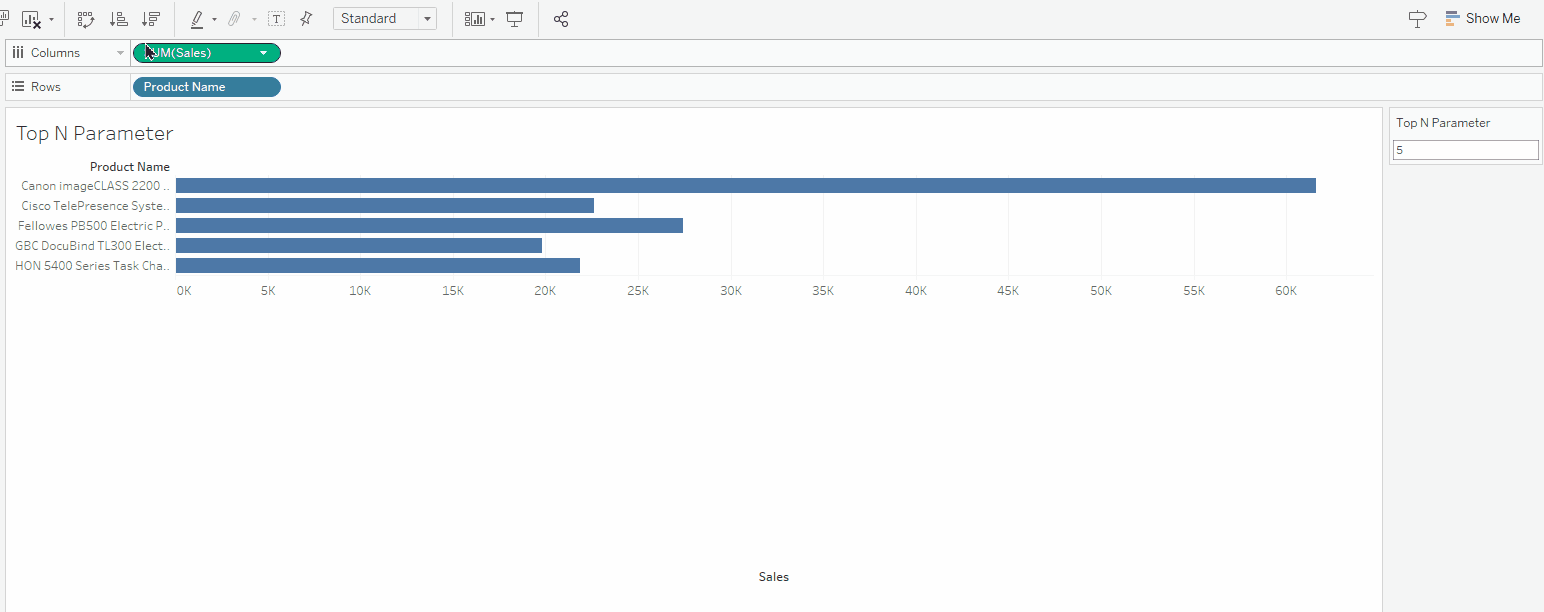
- In the Parameter Control Card (on the right of the viz), click the type-in field and enter the number
10or any other N integer to update the chart dynamically.
Ensure that other filters in your worksheet are added to context so Tableau applies these filters to your data before calculating the Top N values.