


It’s day one of Dashboard Week at the Data School New York! In case you aren’t familiar, Dashboard Week takes place during our final week of training here at Data School. During this week Data Schoolers are tasked with creating and presenting a dashboard each day using a data set provided by our coach. Additionally, this data is often accompanied by specific tasks or instructions for us to address in our dashboard design.
Here is the link to my final viz
Day 1 Topic
Today’s topic was inspired by my coach’s recent trip to Portugal. Our task was to build an exploratory dashboard using a data set containing detailed information about golf courses throughout Portugal. As someone who knows nothing about and has never really played golf (does top golf even count?) I found today’s topic particularly challenging.
Data Exploration and Preparation
I spent about an hour looking through the data this morning and much to my dismay most of the column names and information was in Portuguese. This presented another layer of complexity to an already challenging task. However, my Spanish language skills made it much easier to understand and translate the data with some help from Google. Once I understood each column in the data, I began prepping the data to be visualized. I performed basic data cleaning in Tableau Prep and then used Alteryx to extract and pivot the information in the Amenities.
Wireframing
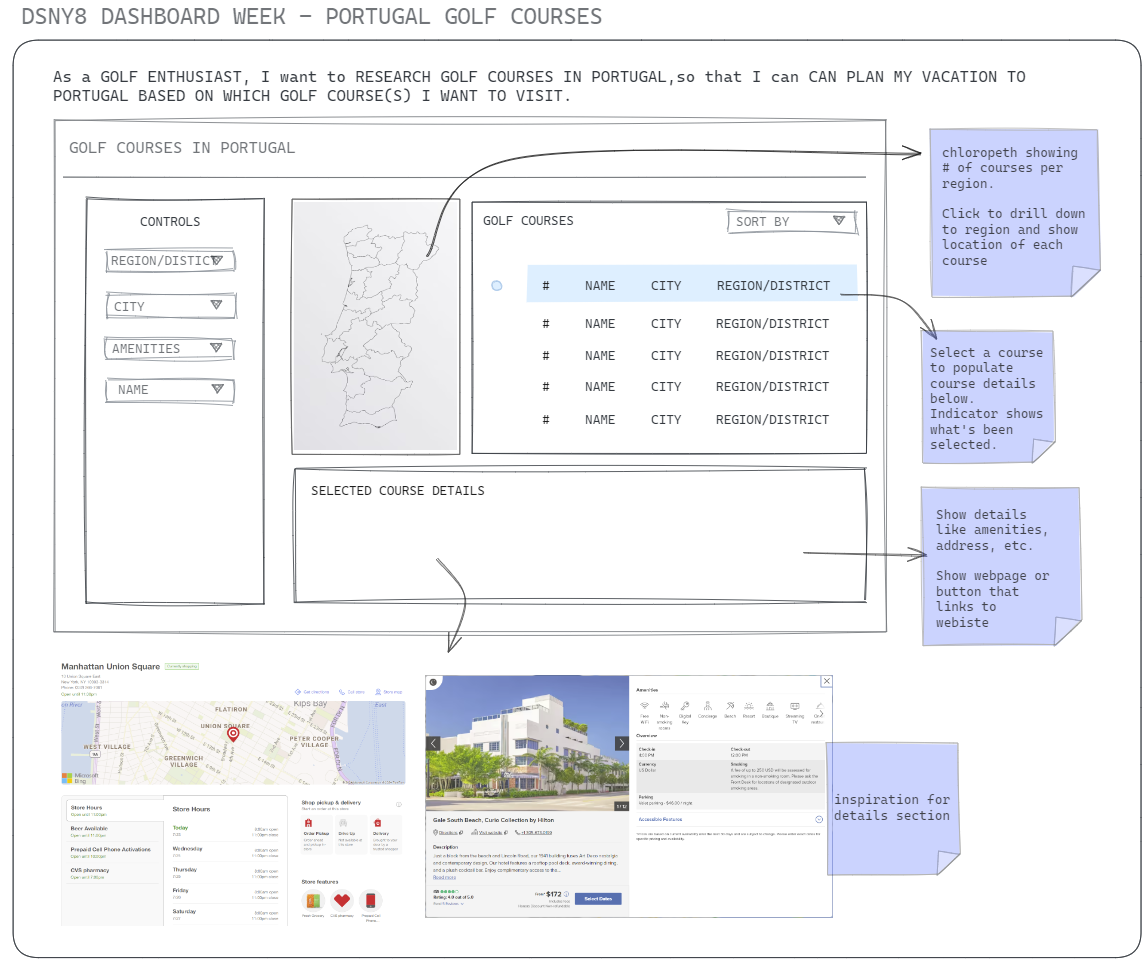
Before building my dashboard in Tableau, I spent about 30 minutes crafting a user story and developing a wireframe. I find that identifying your intended user and thinking about what questions they’re looking to answer with your data is essential in choosing the best charts and layout for your dashboard. In this case of today’s topic, I defined my user as a golf enthusiast who wants to research golf courses to visit during their trip to Portugal. With this in mind, I designed the wireframe below, drawing inspiration from the "find a store/location" feature on most retail and hotel sites.
Dashboard Design
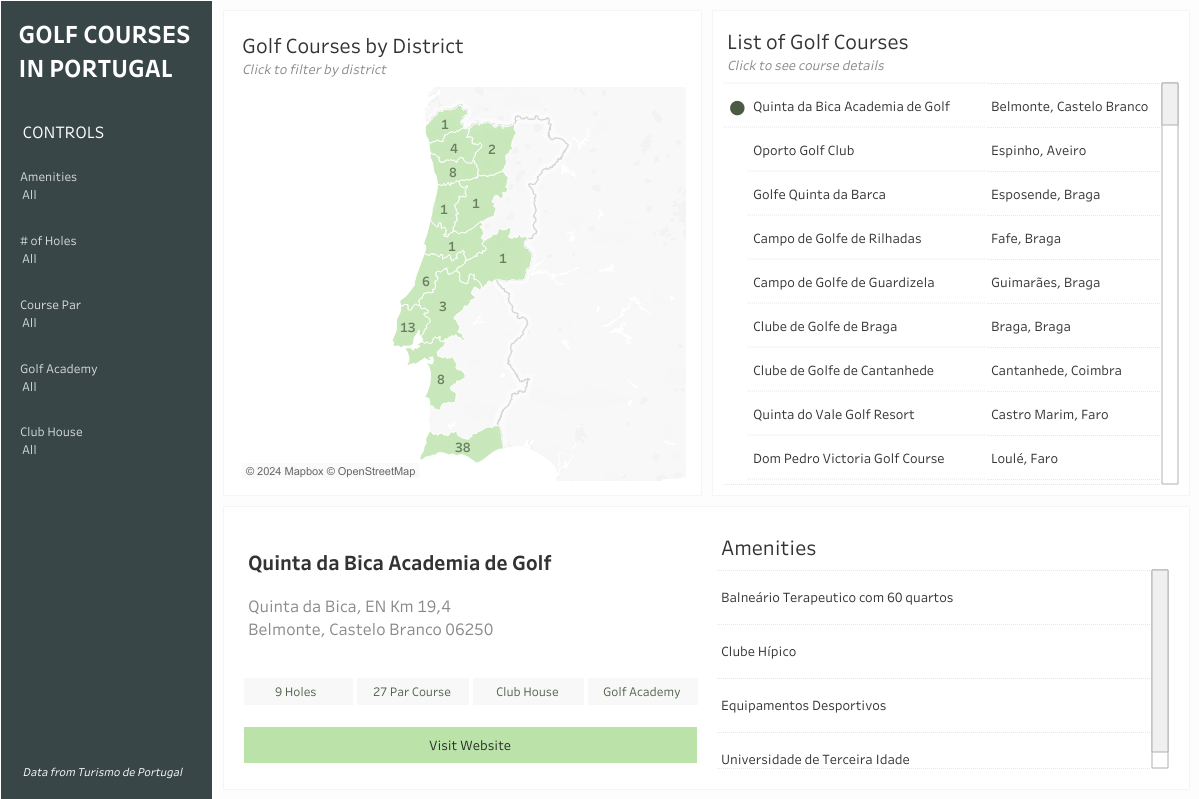
Armed with my wireframe and clean data set I finally began building my dashboard in Tableau. When designing the charts that would go on my dashboard, I tried to keep it simple with my main focus being on a drill-down map that would allow the user to see the number of golf courses per district/region. They could then click on the district they are interested in to see where those golf courses are located. That would then also update the table of golf courses listed on the right. Finally, the user can select one of the courses listed in the chart to see more detailed information about the course, including a list of amenities and a button that links to their website. Additionally, I included several filters on the right that would allow the user to filter only to those golf courses that fit their specific needs.
In terms of dashboard design, I tried to keep it very clean and incorporated shades of green inspired by the lush greenery of a golf course.
What Could Have Been
If I had more time for this project, I would have loved to utilize Alteryx’s GeoSpatial tools to find the nearest airport and other relevant locations to each course. Additionally, I would have loved to incorporate images of each course in the details section.
Lessons Learned
- Time management is key when you only have a day to prep and visualize your data. This often means having to scope down and being realistic with what you can build.
- I built my first drill-down chart using a YouTube tutorial from Andy Kriebel. I thought it was an ingenious way to drill down when the maps you’re using are formatted and structured completely differently. The only issue I had was that this trick was buggy on Tableau Public.
- Golf! Not quite a golf expert yet but I can say I have a far greater insight into the things that matter to golfers.