


The final day is here.
Today’s data was about powerlifters, and since we only had half a day to produce our dashboard, little (no) data prep was required.
Since we only had to focus on dashboarding, I quickly came up with a lot of ideas which took up my first hour. Then I slowly wanted to refine what I wanted to build. I had a few ideas that I kept around but were quite complex to do in the short time span. (eg. violin plots)

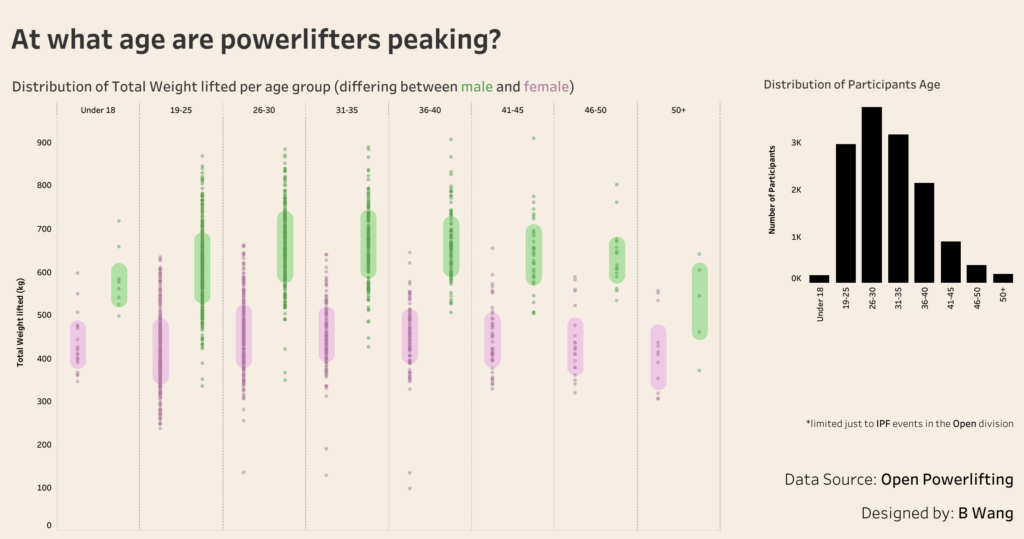
Eventually I kept it simple, 2 charts with 1 being the main focus and another histogram for context. A variation on the peas in pods charts I like, except this time the pods are the box plot area.
Overall, I’m pretty happy with how this week went. A lot of fun new things were tried and experimented with. New software, interesting limitations to overcome, and 5 new dashboards.