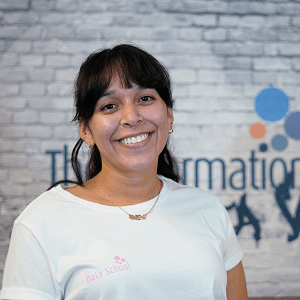
Tabitha Diaz

Tabitha is a dynamic professional with a diverse background that uniquely positions her for success at The Data School NY. Graduating from NYU with a major in Theatre and a minor in Business Entertainment and Media Technology, Tabitha combines her passion for the arts with a strong understanding of the entertainment industry's business side. Seeking new challenges, she pursued Fullstack Academy's Data Analytics Accelerator program in partnership with TTP, where she gained proficiency in Excel, SQL, Python, and Tableau.

Eager to apply her diverse skill set, Tabitha is excited to contribute her unique background to help companies harness the power of data.
Certifications

Blog Posts

Avatar
Fri 29 Sep 2023 | Tabitha Diaz
Dashboard Week - Day 5
And just like that ... it's a wrap! For the final day of dashboard week, we were challenged to create a dashboard from the dataset DSNY 5 used for their application viz. Normally, what would be a fun challenge became even more stressful due to torrential downpour in NYC
Avatar
Fri 29 Sep 2023 | Tabitha Diaz
Dashboard Week - Day 4 Spotify/Youtube
Dashboard week is quickly coming to a close and for day 4, we got to work with data that contained information from Spotify and Youtube on the top 10 songs by various artists. The data - https://www.kaggle
Avatar
Wed 27 Sep 2023 | Tabitha Diaz
Dashboard Week - Day 3 (Rick and Morty)
It's day 3 of dashboard week and I am here to report that things have gotten easier but also more challenging!   Today's challenge was focused on APIs, specifically a really thorough one on Rick and Morty. As a fan of the show, I was super excited to begin working with the data
Avatar
Wed 27 Sep 2023 | Tabitha Diaz
How to Build a Sunburst Chart (Tableau)
Recently, I learned how to make sunburst charts in Tableau using map layers. Map layers are a powerful function in Tableau and can be used to create many different charts and tables outside of multi-layered maps
Avatar
Tue 26 Sep 2023 | Tabitha Diaz
Dashboard Week - Day 2 (Survey Data)
For day 2 of dashboard week, we took on survey data! The data set explored the preferences, interests, habits, opinions, and fears of young people. The survey data was conducted in 2013 and all participants were of Slovakian nationality aged between 15-30
Avatar
Wed 06 Sep 2023 | Tabitha Diaz
Dynamic Standard Deviation Band in Tableau
A few weeks ago, for a client project, I was interested in allowing the client to adjust the standard deviation of a chart. Before this project, I would create the standard deviation through the analytics pane
Avatar
Mon 25 Sep 2023 | Tabitha Diaz
Bundesliga Dashboard: From Web Scaping to a Dashboard in a Day
Dashboard week is in full swing in the NY office and for day 1 our challenge was to web scrape the German Bundesliga Website and then build an interactive exploratory dashboard
Avatar
Wed 13 Sep 2023 | Tabitha Diaz
Tableau: Dummy Fields
Ever work in Tableau and have all your bars unhighlight once a user selects one? Sometimes, this is exactly what you want your dashboard to do, but other times that might not be the case. There's a quick fix to avoiding this issue and it involves using a "Dummy" calculation
Avatar
Fri 25 Aug 2023 | Tabitha Diaz
Making a Butterfly Chart
Butterfly charts are a great way to show a comparison between two values. In two recent Makeover Mondays, I have decided to build butterfly charts to visualize the data. What I love about butterfly charts is that they are fairly simple to create and look visually appealing
Avatar
Mon 28 Aug 2023 | Tabitha Diaz
Designing a Mobile Dashboard on Tableau
This past week I was lucky enough to be challenged to build a mobile dashboard for a client. As excited as I was for this new challenge, I realized I didn't know where to start. If you do a search on building out mobile dashboards there are very few resources
Avatar
Fri 18 Aug 2023 | Tabitha Diaz
Alteryx: How to Create Chained Apps
If you've had experience working in Alteryx you know that you can create both macros and Apps using Interface Tools. Recently, I was working on a workflow where I wanted to create an App based on a given year and specific top Ns
Avatar
Thu 17 Aug 2023 | Tabitha Diaz
How to Create SQL Joins in Alteryx
When I was first introduced to Alteryx I couldn't wrap my head around why the outputs were so different than the ones you can create in SQL. The great news is you can create those same SQL outputs in Alteryx without any need to code
Avatar
Wed 16 Aug 2023 | Tabitha Diaz
Alteryx: Union Tool
If you've checked out my blog post on the Join Tool in Alteryx, you'll be pleased to find out that the Union Tool combines data in the same way as most other applications with a few more options. What is a union? * The Union Tool can be used to combine two or more datasets with similar fields
Avatar
Wed 26 Jul 2023 | Tabitha Diaz
Five Things I Learned As a Project Manager
During your time at the Data School each data schooler must project manage at least one project during the 4 month training. When I first found out about this I was one terrified and two had no idea how spending time as a PM would help my work as an analyst
Avatar
Thu 22 Jun 2023 | Tabitha Diaz
Alteryx: Join Tool
Before breaking down the Join Tool within the context of Alteryx, it is important to recognize that the joins do not work in the same way as joins in SQL. What is a Join? * A tool that can be used to bring together two datasets to create one cohesive dataset
Avatar
Mon 26 Jun 2023 | Tabitha Diaz
Tableau Containers
Until a few weeks ago, I never used containers to build a dashboard. I would spend hours working on one dashboard with multiple floating parts. At the time it was fun until the dashboard needed to be switched around or the sizing changed
Avatar
Mon 26 Jun 2023 | Tabitha Diaz
Alteryx Core Exam Tips
Last week, I had the opportunity to take both the Alteryx Foundational Micro-Credential and the Designer Core Certification. As someone who hasn't taken an exam of over two hours in 10 years, I was nervous to begin. Here are some tips I can share that helped me pass the Core Certification
Avatar
Tue 20 Jun 2023 | Tabitha Diaz
Colors in Calculated Fields (Tableau)
As our first week diving into Alteryx comes to a close, I have developed an appreciation for Tableau's coloring within calculated fields. Something so simple and something I have consistently taken advantage of isn't available within most of Alteryx, except within the Formula Tool
Avatar
Tue 13 Jun 2023 | Tabitha Diaz
Inside Tableau Prep: Clean Step (Filter + Clean)
Cleaning data is an important part of preparing your data for working with it at any stage. By cleaning your data you are ensuring that the data is the correct quality
Avatar
Fri 09 Jun 2023 | Tabitha Diaz
My 1st #MakeoverMonday
If you've spent time scrolling through Tableau you might have stumbled upon the #MakeoverMonday hashtag, but what is it? Makeover Monday is a challenge that occurs weekly. On Monday, the data community is given a dataset to visualize, focusing on effective visualizations
Avatar
Thu 08 Jun 2023 | Tabitha Diaz
Applying to The Data School
Before applying to The Data School, I didn't like Tableau. Why? I never worked with it to create a project I was passionate about. A lot of our inability to learn and enjoy new programs comes from a lack of interest in our work. This brings me to my first point... the importance of a dataset
Powered by The Information Lab
1st Floor, 25 Watling Street, London, EC4M 9BR
Subscribe
to our Newsletter
Get the lastest news about The Data School and application tips
Subscribe now
© 2025 The Information Lab