Sophie Higson

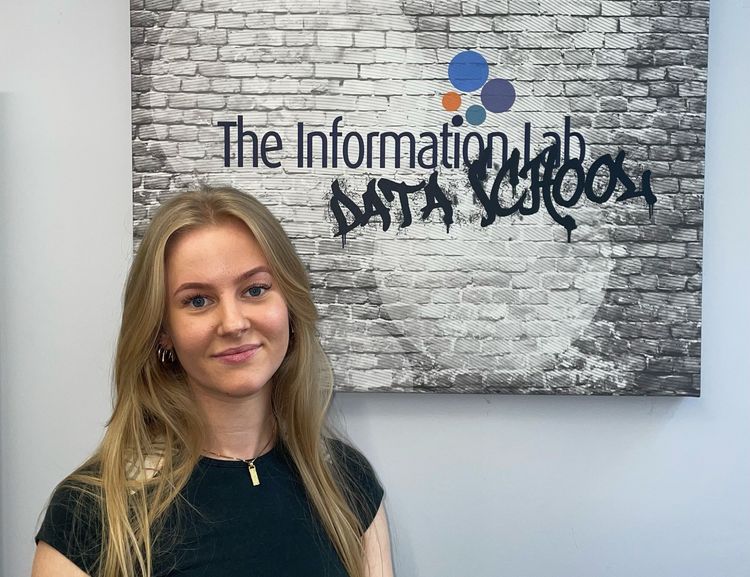
Handling data at university became commonplace for Sophie while completing her Bachelor’s degree in Criminology with Psychology, achieving a 1st at the University of Portsmouth. In particular, her dissertation project fuelled her curiosity for interpreting unique datasets and uncovering a story that could be told.

After realising that handling data could be enjoyable, creative, and itched her desire to problem solve, she got stuck into learning Tableau. Tableau was able to tell a story in a more impressive manner than her dissertation ever could. She then found herself applying for the Data School where her skills could grow.

During her time she has explored the capabilities of Tableau, Alteryx, and PowerBI and put her skills into practice in her first placement at PwC as a Data Analytics Trainer. She has loved every opportunity to problem solve, support, train and analyse along her Data School journey and looks forward to the next stage of her learning.
Certifications

Blog Posts

Avatar
Tue 01 Nov 2022 | Sophie Higson
Download multiple images from HTML link using Alteryx (Pokémon Edition).
Instead of manually saving multiple pictures, try using a HTML code and Alteryx workflow to make this process quicker and efficient.
Avatar
Mon 04 Jul 2022 | Sophie Higson
How to highlight the highest and lowest points of a line chart using LODs.
Spark lines showing the minimum and maximum values highlighted.
Avatar
Thu 15 Sep 2022 | Sophie Higson
How to in import multiple sheets from an excel file into Alteryx using dynamic input tool.
Importing multiple sheets into Alteryx in just 2 steps.
Avatar
Wed 28 Sep 2022 | Sophie Higson
Day 3 Dashboard Week - Accessibility
Dashboard Week: Accessibility Design Task Glasgow City Council are trying to make their city’s data more accessible to residents, and have given us a sample of road repair data from FixMyStreet to show what we can do
Avatar
Tue 27 Sep 2022 | Sophie Higson
Day 2 Dashboard Week - Building University Dataset Mockaroo and Build KPI Dashboard in PowerBI
Scope: MUST include Time series At least 3 dimensions; e.g., products, suppliers, etc. Geographical data At least 4 measures; e.g., sales, profit, targets, etc. Demographic data about customers (so there must be customers in the data set) Anything else they wish to include in their dataset
Avatar
Mon 26 Sep 2022 | Sophie Higson
Frist Day of Dashboard Week - Using API and APPs in Alteryx which automatically updates a KPI dashboard.
The steps to create a workflow using two sets of APIs and an Analytical App in Alteryx to automatically update a simple KPI dashboard on crime.
Avatar
Mon 04 Jul 2022 | Sophie Higson
Fixed LODs Explained and How to Compare Current Year to Previous Year.
This is a very useful and specific example of when to use Fixed LODs, with some theory behind what they are doing.
Avatar
Sat 09 Jul 2022 | Sophie Higson
Using Power BI to remake a Tableau Dashbaord.
This post includes my experience and opinions of using Power BI compared to Tableau, as well as some 'how to' answers for first time users.
Avatar
Wed 06 Jul 2022 | Sophie Higson
How to get rid of a highlighted chart when it is selected in Tableau.
If you get confused between count and count distinct and which one you should use then hopefully this can clarify a few things.
Avatar
Wed 20 Jul 2022 | Sophie Higson
How to Union Multiple Tables in Tableau Prep Using a Wildcard.
Rather than dragging three separate tables into Prep, you can union them very easily using a wildcard.
Avatar
Thu 14 Jul 2022 | Sophie Higson
How to replace your data source in tableau.
If you have already chosen some data to analyse in Tableau but you want replace this original data with a newer updated version, you are able to do this very easily.
Avatar
Mon 11 Jul 2022 | Sophie Higson
How I solved Alteryx Challenge #5.
! SPOILER ALERT ! My take on solving Alteryx challenge #5.
Avatar
Wed 06 Jul 2022 | Sophie Higson
How do you join spatial files in Tableau?
Confused when to use a spatial join, how to do it, or what the outcome is? Look no further.
Avatar
Mon 04 Jul 2022 | Sophie Higson
Tableau Dimensions and Measures - What Are They?
Is it important to know the difference between the blue and green fields in Tableau? Yes, extremely.
Avatar
Mon 20 Jun 2022 | Sophie Higson
Making Calculated Fields Easier to Use in Tableau
Want to make calculated fields easier to use and understand? Here are a list of suggestion to get you started.
Avatar
Thu 16 Jun 2022 | Sophie Higson
How do you make graphs interactive on Tableau with parameters?
Using parameters is one way of allowing you to create an interactive dashboard. Interactivity lets you get the most amount of information onto a graph/chart without overwhelming the reader, as well as give more freedom to explore.
Avatar
Mon 06 Jun 2022 | Sophie Higson
Alteryx Fundamentals: Making a Mountain Out of a Molehill?
Feeling overwhelmed when first starting out with Alteryx? As shown by my first week at the Data School, believe me, you are not alone. However, it is not as daunting as you might think.
Powered by The Information Lab
1st Floor, 25 Watling Street, London, EC4M 9BR
Subscribe
to our Newsletter
Get the lastest news about The Data School and application tips
Subscribe now
© 2025 The Information Lab