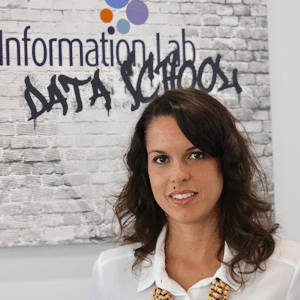
Rachel Costa

After 10 years working as reporter for several news outlets in Brazil, Rachel started to fell curious about new ways to tell stories – ways using more than words. The idea of working with data visualisation came after seeing “Snow Fall” for the first time (one of the first interactive stories, published by The NY Times). This was the moment in which learning these skills became a plan and Tableau arisen as a great tool to do that (allowing to test formats and colours in a hassle-free way). From her background she brings the obsession with making information accessible for the audience in a clear, effective and beautiful way.

Aside from the Data School, Rachel can be found in coding meetups (fighting against Phyton or JS), yoga classes, taking care of her “pet” (a sourdough called Barackterias), cooking or planning the next trip together with her Portuguese husband.
Blog Posts

Avatar
Fri 30 Dec 2016 | Rachel Costa
My to-do list to be put in practice in the New Year
Instead of moping over the past, let’s enjoy the last Friday of the year to build the traditional to-do list for 2017 Our last philosophic post of 2016 is about “if I had to start all over again…”. (The others from this series are My 7 biggest challenges in the Data School [https://www
Avatar
Thu 29 Dec 2016 | Rachel Costa
This is not another article about success
Because success is overrated, I decided to be more realistic and share 9 tips to survive the Data School experience Andy Kriebel [https://twitter.com/VizWizBI] gave us a list of philosophical subjects to write about this week
Avatar
Wed 28 Dec 2016 | Rachel Costa
My 7 biggest challenges in the Data School
The most challenging things for a Brazilian journalist lost in the Data School Four days to the next year and here I am in front of a computer thinking about the things I have found most challenging in the Data School
Avatar
Fri 23 Dec 2016 | Rachel Costa
Alteryx tips: Scraping data from Wikipedia using Wikidata
Wikipedia is full of interesting and structured data, so why not get it to use in a visualisation? In this blog post I go through my first experience scraping Wikipedia This week we have played around ways to use APIs in Alteryx
Avatar
Thu 01 Dec 2016 | Rachel Costa
Web editing: Tableau Server vs Tableau Desktop
If you are a user of Tableau Server you possibly noticed that it is possible to either create or edit views and dashboards online. However the functionalities in the server are not exactly the same than in Tableau Desktop
Avatar
Thu 24 Nov 2016 | Rachel Costa
Tableau Tip: Customizing a bar chart to make it a hug
Bar charts don’t need to be boring.They can be customised to give a twist in your visualisation, creating a different visual effect Yesterday we played around body measures from the Data School people. It was part of a crazy idea of Iron Viz that Andy had (he explained it here [https://www
Avatar
Wed 23 Nov 2016 | Rachel Costa
Merging data in Tableau: Blend or join your datasets?
Tableau offers different ways to merge your data. Learn the differences between them to choose when to blend or to join your datasets Sometimes you would like to use more than one dataset at the same time to create your dashboard
Avatar
Tue 22 Nov 2016 | Rachel Costa
How to create hex tile map in Tableau
Avatar
Mon 21 Nov 2016 | Rachel Costa
3 steps to work with regression analysis in Alteryx
In the second part of my mini series about predictive analytics, I will show you the steps to perform regression analysis in Alteryx As promised on my first post about Predictive Analytics (you can find it here [https://www.thedataschool.co
Avatar
Sun 13 Nov 2016 | Rachel Costa
Creating clusters in Alteryx and Tableau – how different are they?
Clusters are a powerful way to group data and both Tableau and Alteryx offer tools to do that
Avatar
Tue 08 Nov 2016 | Rachel Costa
Tableau: Tips and tricks to build better maps
A quick guide to get rid of countries or states you don’t need in your visualisation, plus an explanation about how to use it to add Alaska (or Hawaii) to your US map We have just finished the #DashboardWeek at the Data School. The idea was to create one dashboard a day from Monday to Friday
Avatar
Thu 27 Oct 2016 | Rachel Costa
3 tips to avoid problems while importing CSV files into Alteryx
Are you finding messy data after importing a CSV file into Alteryx? Keep these three tips in mind and avoid disappointments CSVs rock. I really like the format
Avatar
Wed 26 Oct 2016 | Rachel Costa
Learning Alteryx: The IF function is my new BFF
IF you have no programming/advanced Excel experience and is starting to use Alteryx THEN read this ELSE you can skip this post First time I heard about IF expressions was during a class of introduction to code (OK, I have never been an advanced Excel user, I have to admit)
Avatar
Tue 25 Oct 2016 | Rachel Costa
12 basic tools in Alteryx and what each one does
There are more than 100 tools in Alteryx
Avatar
Mon 24 Oct 2016 | Rachel Costa
Creating unit charts in Tableau with a little help from Alteryx
Tableau doesn’t come with an automated option to create unit charts (or pictograms), but it doesn’t mean that it is impossible to generate one. In this tutorial, I will show how I generated a unit chart using Alteryx Today we had Chris Love (Alteryx Ace and Tableau Zen Master) [https://twitter
Avatar
Mon 17 Oct 2016 | Rachel Costa
3 best practices to make your maps more powerful
Maps are a powerful tool in data visualisation but it is important to pay attention to the details when choose to use them in your work Cartographic representations are one of the oldest ways to visualise data
Avatar
Wed 12 Oct 2016 | Rachel Costa
3 steps to visualise more than 150 years in a clear way
Our way to say “Hello world” from the new Data School cohort is recreating and explaining a visualisation using Tableau. Using UK data about climate change, I created a “calendar heat map”
Powered by The Information Lab
1st Floor, 25 Watling Street, London, EC4M 9BR
Subscribe
to our Newsletter
Get the lastest news about The Data School and application tips
Subscribe now
© 2025 The Information Lab