Lisa Hitch

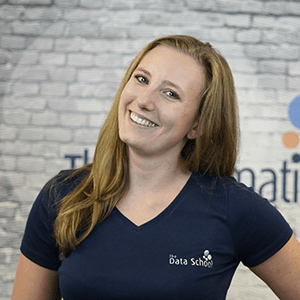
Lisa is a Data Consultant at The Information Lab specializing in helping clients find business insights with Tableau, automate workflows using Alteryx, and optimize data modeling through SQL. She also brings skills from a variety of other statistical and coding software such as R, SAS, SPSS, and Python. At the forefront of her consultancy philosophy is teaching and breaking down complex topics into simple, understandable, and manageable steps. She thrives on sharing her knowledge, offering tailored training sessions, and mentoring clients to build their own data analytics capabilities with confidence.

For example, Lisa worked with a hedge fund for a 3-month period, serving as Center of Excellence for Tableau. During this engagement, she provided more than 18 ad-hoc office hours, over 50 hours of 1-on-1 Tableau teaching sessions, and conducted 4 small group workshops on topics such as Data Modeling, Data Calculations & Parameters, LODs & Table Calculations, and Tableau Server Fundamentals. In addition to training, she built 7 dashboards for trading and corporate access relationships, saving more than 350 hours of manual data updates annually.

During a 5-month engagement with Wells Fargo's Analytics Enablement team, Lisa utilized SQL to optimize Tableau workbook performance through database-side using joins, ETCs, and filtering. She then built dashboards on SLA performance, customer language preferences, and exploration tools for trusted data sources. To streamline development, Lisa created a Tableau dashboard template and iterated it based on business needs in collaboration with business stakeholders and data analysts. Additionally, she developed and led a customized 3-part interactive workshop series, covering Tableau topics from beginner to advanced, including breadcrumbing for parameters and filters and dynamic zone visibility.

Lisa's background in public health research and biostatistics has deeply informed her approach to data consultancy. Currently pursuing her PhD in Community Health at the CUNY Graduate School of Public Health, she focuses on leveraging dashboards to inform public health policymaking. In addition to her consultancy work, Lisa is an Adjunct Lecturer for Applied Biostatistics and Quantitative Research Method teaching foundational and advanced analytical techniques to graduate-level students.

In her leisure time, Lisa enjoys rock climbing, traveling, playing tennis and squash, and finding the best cup of coffee in NYC.
Certifications

Blog Posts

Avatar
Wed 28 Feb 2024 | Lisa Hitch
Tableau How-To: Create Parallel Coordinates Charts
Do you need a chart to compare multiple measures across members? Do you want to compare how someone ranks across different sub-scores compared to other members? Then a Parallel Coordinates Chart may be for you. This blog article will give step-by-step instructions how to build them
Avatar
Mon 26 Feb 2024 | Lisa Hitch
Tableau How-To: Make a Custom-Shaped Chart out of Individual Data Points
Did you ever want to learn how to create a custom shape out of data points? Where each data point stands for a certain name or ID, but then the dots create a larger image? It's actually much easier than it looks and this blog article will teach your step-by-step how to do it
Avatar
Tue 30 Jan 2024 | Lisa Hitch
Lessons Learned from Teaching Consultancy & Tableau
I had the incredible opportunity to teach consultancy and Tableau (advanced business charts, including Marginal Histograms, Parallel Coordinates Charts, and Burndown Charts) and I will share my lessons learned here
Avatar
Wed 31 Jan 2024 | Lisa Hitch
Lessons Learned from a Short-Term Consultancy Project
A few weeks ago, I had the incredible opportunity to work on a short-term consultancy project (~2 weeks) as the sole data consultant. Here are some of my takeaways, experiences, and lessons-learned.
Avatar
Tue 23 Jan 2024 | Lisa Hitch
Why (And How) to Document Your Work as a Data Consultant
As a Data Consultant, documenting your work is an extremely crucial part of your work. This article will break down why we need to document our work, best practices how to do that, and show you plenty of examples in Alteryx, Tableau, and Tableau Prep how this could look like
Avatar
Wed 10 Jan 2024 | Lisa Hitch
Why Stakeholders love Sketches & Wireframing
This article explains using a real-life example why you should start using Dashboard Sketches with working with stakeholders in data consultancy and introduces a free-to-use tool.
Avatar
Fri 01 Dec 2023 | Lisa Hitch
Dashboard Week 5: Revamp your Initial Application
Learn more about how I used Dashboard Week to re-create my initial application viz: from sketching it out and creating new visualizations, to creating a new dashboard.
Avatar
Fri 25 Aug 2023 | Lisa Hitch
Tableau How-To: Create a Sunburst Chart with Map Layers
Learn Step-by-Step how to build a Sunburst Chart (with Map Layers in Tableau) and when it makes sense to use one.
Avatar
Wed 29 Nov 2023 | Lisa Hitch
Why LinkedIn is Crucial for Your Career as a Data Consultant
Need 6 reasons why LinkedIn is crucial for you as a Data Consultant? Read this article to find out how LinkedIn can help your career and your professional development. Also, read about tips how to be more active on LinkedIn.
Avatar
Wed 22 Nov 2023 | Lisa Hitch
Lessons Learned from being a Project Manager for 4 days
My Data School cohort (DSNY5) is coming to the end of our training. And with that we also finished our last client project which was with a wealth investment firm
Avatar
Wed 22 Nov 2023 | Lisa Hitch
Dashboard Week 1: Youth Survey
At the end of our 4-month intensive training to become Data Consultants we practice our learned skills through the so-called "Dashboard Week". It is quite a fun invention! At 9am we receive a dataset and have until 3
Avatar
Tue 31 Oct 2023 | Lisa Hitch
Accelerating your Dashboard: 10 Tips to Reduce Lag Time
Imagine this scenario: You built an amazing dashboard with lots of interactivity, filters, and parameters. It looks stunning and you present it to the CEO of the company you are consulting for. Everyone is excited to see what your dashboard can do
Avatar
Tue 17 Oct 2023 | Lisa Hitch
Alteryx Analytical Apps: Common Mistakes and How to Solve Them!
Alteryx's analytical apps are a great functionality where the user can choose certain values which then change the workflow and create a customized output. For example, the user could choose a certain category or date range that filters the final results
Avatar
Mon 16 Oct 2023 | Lisa Hitch
Alteryx Mini Tip Series: Spatial Data - Creating Donut Areas Instead of Circles
This blog article teaches you how to use Alteryx to create a donut-shaped area around a center point in your spatial data.
Avatar
Tue 10 Oct 2023 | Lisa Hitch
How I Approach Building a Dashboard in 1h
One challenge that we are faced in the Data School (which is extremely good practice for data consultancy ) is to complete a MakeoverMonday in 60 minutes, which is incredibly challenging. Here are some lessons I learned and strategies I applied.
Avatar
Fri 25 Aug 2023 | Lisa Hitch
The Power of Asking Questions
I always loved the Information Lab's company philosophy "Asking questions encouraged". In preparation for this blog post, I went on a journey to interview as many colleagues as possible about their take on the power of asking questions.
Avatar
Wed 27 Sep 2023 | Lisa Hitch
Why Data Consultants Need APIs
Have you ever heard about APIs (Application Programming Interface)? Have you ever used one before? Chances are that you did, even though you may not have known what it is or how it works. So let's dive into it.
Avatar
Fri 25 Aug 2023 | Lisa Hitch
How I approached my Final Interview Dataset
This was my approach to working with a new dataset for my Data School Final Interview Stag. This was the first time I had ever worked with a new dataset in such a short amount of time and I will share what worked and what did not work for me.
Avatar
Tue 29 Aug 2023 | Lisa Hitch
Tableau How-To: Create neat-looking KPI cards
Business Dashboards have the intention to convey key metrics quickly to the user  or stakeholder, which is why a lot of business dashboards use little sections (so-called "cards") to highlight those key metrics and how they are trending
Avatar
Fri 25 Aug 2023 | Lisa Hitch
Alteryx Mini Tip Series: Customizing your Tool Bar
Did you know that you can customize your Alteryx toolbar? Alteryx offers more than 270 tools at the time of writing this this article. This can feel overwhelming. And especially when starting out, you may use certain tools over others
Avatar
Tue 22 Aug 2023 | Lisa Hitch
From Submitting an Application Dashboard to a Data School Acceptance
This article is about my timeline from when submitted my first application dashboard until I received the acceptance into the Data School, divided into 3 sections: Prepare for Phone Interview, Prepare Final Dashboard, and Prepare for Final Interview
Avatar
Wed 16 Aug 2023 | Lisa Hitch
9 Ways to Create Calculated Fields in Tableau
Did you know that there are 9 different ways to create a calculated field in Tableau? Read on to find all the ways how to create calculated fields in Tableau
Avatar
Mon 14 Aug 2023 | Lisa Hitch
Tableau Prep Mini Tip Series: Where to insert a new step in an existing flow?
Two different ways to insert Tableau Prep flow steps: one that creates a new branch, the other does not.
Avatar
Tue 15 Aug 2023 | Lisa Hitch
How to go from 0 to a Data School Application Dashboard in 40 days
This article is about my 40 days from when I first learned about the Data School to submitting my initial application dashboard, including my resources.
Avatar
Thu 10 Aug 2023 | Lisa Hitch
"Data" and "Information" is NOT the same!
Data and information is not the same! Data is the foundation for information. Without data, we cannot have information. But data can exist by itself in a more unstructured way without context. When we put it into context we create information.
Avatar
Thu 10 Aug 2023 | Lisa Hitch
Joins expand data horizontally, Unions expand data vertically ... Or not?
Researchers, data analysts, and data consultants will -at some point- have to combine multiple datasets to create a larger or more complete one. There are different ways on how to combine them.
Avatar
Wed 09 Aug 2023 | Lisa Hitch
What does a data consultant do? Or how a sandwich becomes a business decision
When I told everyone that I wanted to be a Data Consultant, I often got impressed nods, but puzzled looks
Powered by The Information Lab
1st Floor, 25 Watling Street, London, EC4M 9BR
Subscribe
to our Newsletter
Get the lastest news about The Data School and application tips
Subscribe now
© 2025 The Information Lab