Islande Derazin

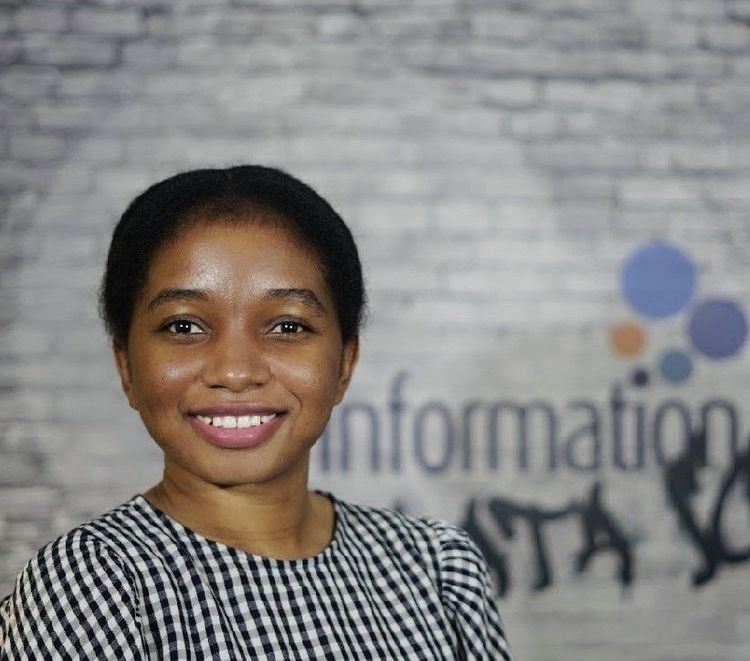
Islande is a member of the first cohort for The Data School New York. She showcased her Tableau skills by entering the Iron Viz competition after four months of training.  A good design aesthetic is an important aspect of her dashboards and her work was featured in Tableau Public’s Viz Wrap: Interesting Data Visualisations from 2022

After earning a B.S. in Computer Science from Brooklyn College, she worked in the data field and engaged with COOP, a non-profit fostering technical and soft skills. Committed to growth, she joined Toastmasters for public speaking and maintains her Tableau skills through challenges like Workout Wednesday, Tableau Prep, and Alteryx.
Certifications

Blog Posts

Avatar
Sat 01 Oct 2022 | Islande Derazin
Day 5 Dashboard Week: Boy Bands
Day 5 dashboard week is about Boy Bands. The data is available on GitHub. We can use Power Bi or Tableau, I use Tableau. There wasn’t a lot of cleaning in the database. In this dashboard, I show the songs with the highest rank by year. The top bands and the instruments played by most members
Avatar
Fri 30 Sep 2022 | Islande Derazin
Dashboard Week: Day 4 Breaking Bad
On day 4, I had to use the API to get Characters, episodes, quotes, and deaths from every episode of Breaking Bad and Better Call Saul. I use this website to get the data. In this workflow, I bring information on the number of deaths in the show and what episodes they happened
Avatar
Thu 29 Sep 2022 | Islande Derazin
Dashboard week Day 3: UK Crime Rate API
On Day 3, we had to create an App in Alteryx, and we had to pull the data from the UK Street Crimes website. The requirements for the assignments are noted below: Build an Alteryx App that allows the user to pick a date range and category and enter a postcode
Avatar
Tue 27 Sep 2022 | Islande Derazin
Dashboard Week Day 2: KPI Dashboard
Today, we learn about Power BI. The task is to pick an industry and use Mockaroo to create a data set with the industry of our choice. Then create a KPI dashboard using Power BI. For the Mackaroo data there are a few boxes we had to check: Data MUST include: 1. Time series 2
Avatar
Tue 27 Sep 2022 | Islande Derazin
Dashboard Week Day 1: Accessibility Dashboard
Today, for dashboard week we learn about Accessibility: Why make visualization more accessible: Millions of people in the United States are blind or have low vision  Therefore, accessibility in visualization is a great way to make data inclusive and reach a broader audience
Avatar
Mon 15 Aug 2022 | Islande Derazin
Select, From, Where: SQL
SQL is a query language that lets you manipulate data. SELECT will let you select data in a table
Avatar
Wed 22 Jun 2022 | Islande Derazin
My First Week at the Data School
June 6th was my first day at the Data School, and now it's already week three. The number of things we have learned so far feels surreal. In the first week, we sat at the DS32’s client presentation
Avatar
Thu 26 May 2022 | Islande Derazin
My Takeaway After Attending the Tableau Conference for the First Time
In a few weeks time I will be joining the Data School as a member of the first cohort in New York! There’s something about being part of the first cohort that feels so glamorous. You may consider us as the pioneers, and as such we are leading the way for future cohorts in New York
Powered by The Information Lab
1st Floor, 25 Watling Street, London, EC4M 9BR
Subscribe
to our Newsletter
Get the lastest news about The Data School and application tips
Subscribe now
© 2025 The Information Lab