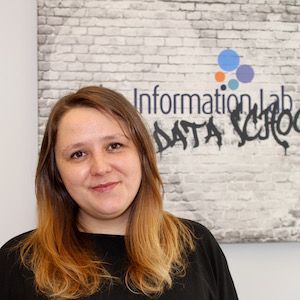
Gaia Fantini

After studying the social aspects of ICT in Europe, Gaia came to London to follow her study interest with a MA in Data and Information Ethics. Gaia believes that digital technologies and information can influence the socio-economic development, and unveiling relationships and patterns in data is crucial to advance such change. She joined the Data School as she found that data visualisation is a powerful instrument towards that.

Here she became highly skilled in Business Intelligence & Analytics, developing a strong background in data analysis and data visualisation. Gaia has a proven track record in developing and delivering data-driven strategies and actionable visual reports to key stakeholders across diverse industries, including finance, energy, transport and satellite communications. At the same time she obtained industry-recognised certifications, significantly enhancing her knowledge of data solutions and strategies.

As a consultant, Gaia helped her clients improve their data products quality by reducing inconsistencies and increasing reliability, boosting user’s trust and engagement. She created automated processes to restore workflows and dashboards, saving months of work and increasing teams performances. She developed and delivered training sessions in Alteryx and Tableau, providing the workforce with independent reporting capabilities, while assuring ad hoc support.
Blog Posts

Avatar
Fri 23 Apr 2021 | Gaia Fantini
Interact with Tableau Server with tabcmd - export workbooks/views
Yesterday, as part of the training at the Data School, I have been introduced to the Tableau Server command line utility, tabcmd [https://help.tableau.com/current/server/en-us/tabcmd.htm]. It allows to interact with the server from your local machine from the Command Prompt
Avatar
Wed 24 Mar 2021 | Gaia Fantini
Dashboard week day 3 - API, Alteryx and Snowflake
New day, new task: today we are asked to download some data from the World Bank API [https://datacatalog.worldbank.org/dataset/health-nutrition-and-population-statistics] upload data in Snowflake. Full disclosure, I never heard of it before in my life, so I had to learn everything today
Avatar
Tue 23 Mar 2021 | Gaia Fantini
Building a dashboard with Alteryx - learn about the Reporting Tools
Second day of the dashboard week is Alteryx day! Today we are asked to create a dashboard in Alteryx, and forget about Tableau - we can still use it to investigate the data if we want to, but the dashboard and all the style must be done with Alteryx Reporting Tools
Avatar
Mon 22 Mar 2021 | Gaia Fantini
Dashboard Week Day 1 - let's go
This week is dashboard week for DS22.  What does it means? Simply put, every day is project day. Which is the by far the toughest day of the week. Sounds fun, am I right? Let's take a deeper look at what this dashboard week is
Avatar
Fri 12 Mar 2021 | Gaia Fantini
APIs and Cocktails
Today at the Data School we have been assigned projects testing our ability to interrogate APIs. I was assigned The Cocktail DB [https://www.thecocktaildb.com/api.php] website, and I was asked to interrogate the API to return all the drinks for each category and information about each drink
Avatar
Tue 09 Feb 2021 | Gaia Fantini
HOW TO CREATE A STANDARD MACRO IN ALTERYX
At the Data School we met Macros a couple times now and I though I would draft a small recap that can be useful for anyone looking to start digging in the topic. Let's start with a bit of theory before going ahead and create a standard macro. 1
Avatar
Tue 19 Jan 2021 | Gaia Fantini
Alteryx Designer Core Certification: I failed, now what?
A few weeks into the training at the Data School, my fellow cohortians and I had to take the Alteryx Core Exam, and only some of us passed. I was not among them
Powered by The Information Lab
1st Floor, 25 Watling Street, London, EC4M 9BR
Subscribe
to our Newsletter
Get the lastest news about The Data School and application tips
Subscribe now
© 2025 The Information Lab