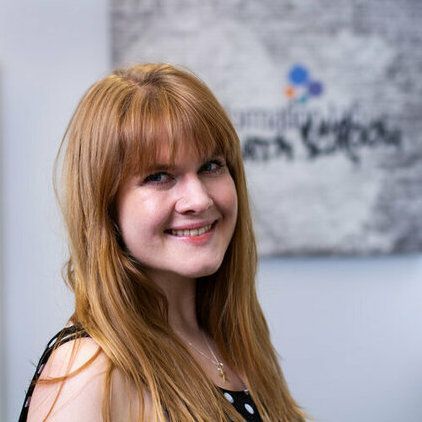
Eve Thomas

Eve graduated with a BSC in History from Kent University and an MSC in HR Management from Sussex University. After graduating she spent two years working as a TEFL Teacher in South America and Madrid, which is where she discovered her passion for teaching.

After returning to the UK she worked in recruitment with the aim to improve her interpersonal and business skills. It was whilst working in recruitment that she came across The Data School. After selling the role to candidates and trying her hand at Tableau, she discovered the importance of making data more accessible and understandable for others decided to apply!
Blog Posts

Avatar
Mon 02 Dec 2019 | Eve Thomas
Passing the Tableau QA Exam (second time's the charm!)
Last week I’m thrilled to say that I passed my Tableau QA exam
Avatar
Thu 24 Oct 2019 | Eve Thomas
Dashboard week - Day 4 - A day of Prep and Power BI
Avatar
Wed 23 Oct 2019 | Eve Thomas
Dashboard Week Day 3: Rural Electricity Demand in India
Today we were tasked with PDF scraping! The data we had to analyse came from Harvard Dataverse looking at rural electricity demand in India. Our task was to scrape the PDF of the original questionnaire to retrieve the question headers, and then then to join them back in to the answers spreadsheet
Avatar
Tue 22 Oct 2019 | Eve Thomas
Dashboard Week - Day 2
Today we were challenged to web scrape the parliamentary rules database – we WERE NOT allowed to download the ready made raw data from the website, but to create our own raw dataset using Alteryx! Web-scraping is not my strong point as it can involve ALOT of Regex
Avatar
Mon 21 Oct 2019 | Eve Thomas
Dashboard Week - Day 1 - Design Census Survey Data
So here we are already at Dashboard week – the last 2 and half months has flown by! Today we were tasked with looking at survey data from the 2019 Design Census
Avatar
Sun 29 Sep 2019 | Eve Thomas
How to create a density map in Tableau using Hexbins
Last week I wrote a blog post on how to create a density map using Alteryx (find it here [https://www.thedataschool.co.uk/eve-thomas/having-fun-with-spatial-how-to-create-a-tile-map-in-alteryx/] )
Avatar
Wed 25 Sep 2019 | Eve Thomas
Having fun with Spatial - How to create a tile map in Alteryx
For MakeoverMonday this week I used Alteryx to create a tile map which I then used to make a density map in Tableau. This is a step by step guide on how I created my tile map in Alteryx using the MakeoverMonday week 39 dataset on San Francisco evictions. Final Viz: https://tabsoft
Avatar
Tue 24 Sep 2019 | Eve Thomas
Creating a simple highlight parameter action in Tableau
In my recent Makeover Monday viz (W33) I had a go at using parameter actions! Here is a very simple step by step guide which will hopefully help you to do the same! Viz link: https://tabsoft.co/2kPNIyNTo create a simple parameter action, we first need to create our parameter
Avatar
Sat 10 Aug 2019 | Eve Thomas
Why attend a Meet & Greet at The Data School?
Almost everyone who currently works at The Data School attended a meet & greet before securing a place
Avatar
Tue 06 Aug 2019 | Eve Thomas
My Expectations of The Data School
Having graduated with a degree in History and an MSC in HR Management, if you had told me 5 years ago that I would be kick starting a career in data at the age of 27, I would have thought you were joking! I was first intro’d to The Data School whilst working at GRB
Powered by The Information Lab
1st Floor, 25 Watling Street, London, EC4M 9BR
Subscribe
to our Newsletter
Get the lastest news about The Data School and application tips
Subscribe now
© 2025 The Information Lab