


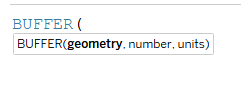
DSNY2 did our spatial lessons just about two months ago, and that’s when we made points and lines. We also learned a third function, BUFFER(), that takes in a point, distance, and unit. It draws a circle around that point, using distance as the radius.
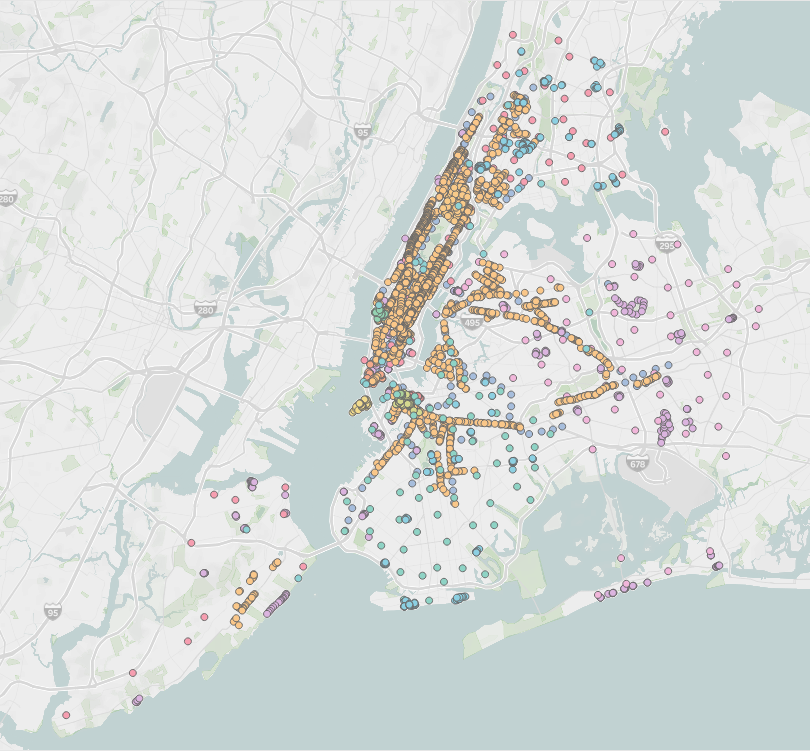
Let’s see this in practice with NYC WiFi hotspot locations. Export this file as a GeoJSON, and bring it in as a spatial file in Tableau.
The globe icon next to your fields indicates that it has a geographic role and is a spatial object. I dragged it to the canvas, and put Doitt Id on detail.
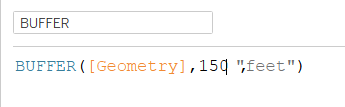
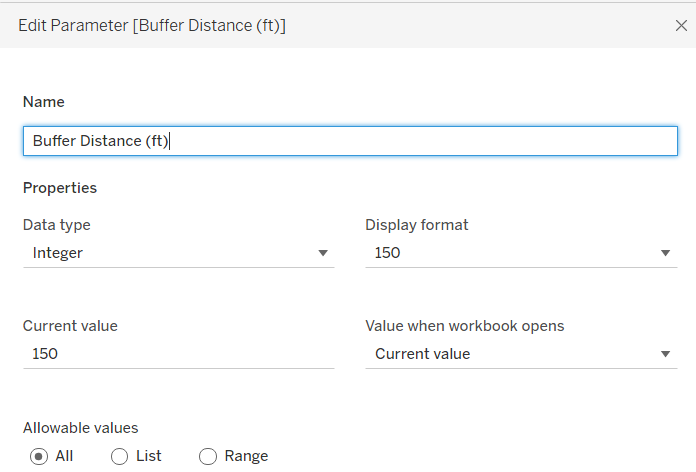
WiFi networks extend about 150 feet, so that’s a reasonable distance to use in the BUFFER function:
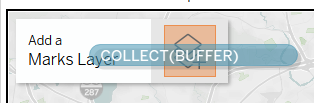
Drag the buffer calculation to the Add a Marks Layer button that appears in the top left of the canvas.
Here’s the DSNY office area, and any nearby Wi-Fi hotspots:
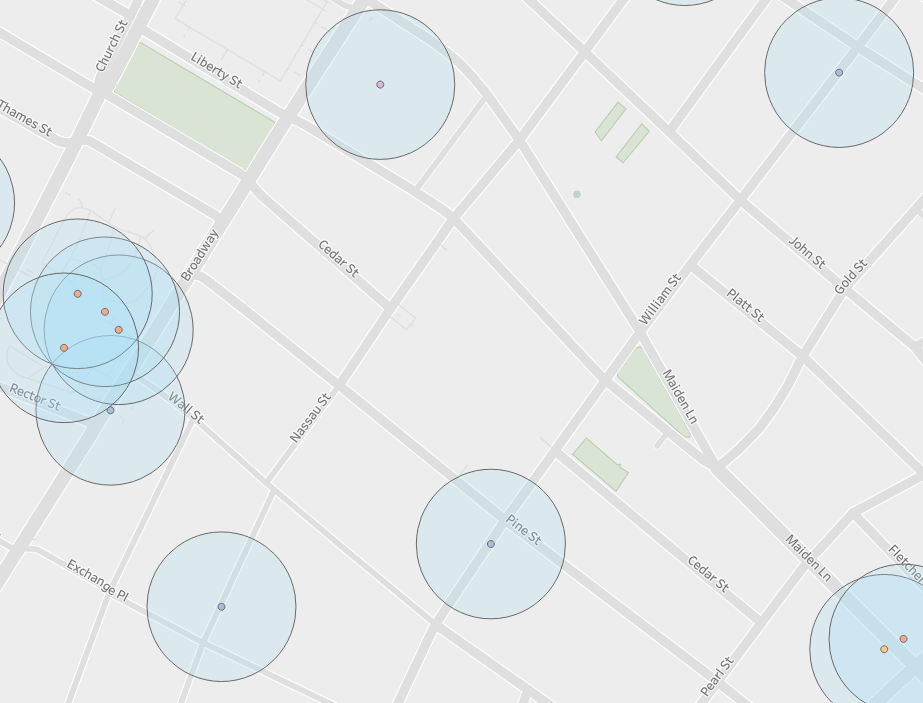
Not really any, but that’s okay, we have WiFi in the office.
When we’re zoomed out, it’s hard to see the buffer area because it’s so small:
So instead of a static 150 feet, we can parameterize the distance.

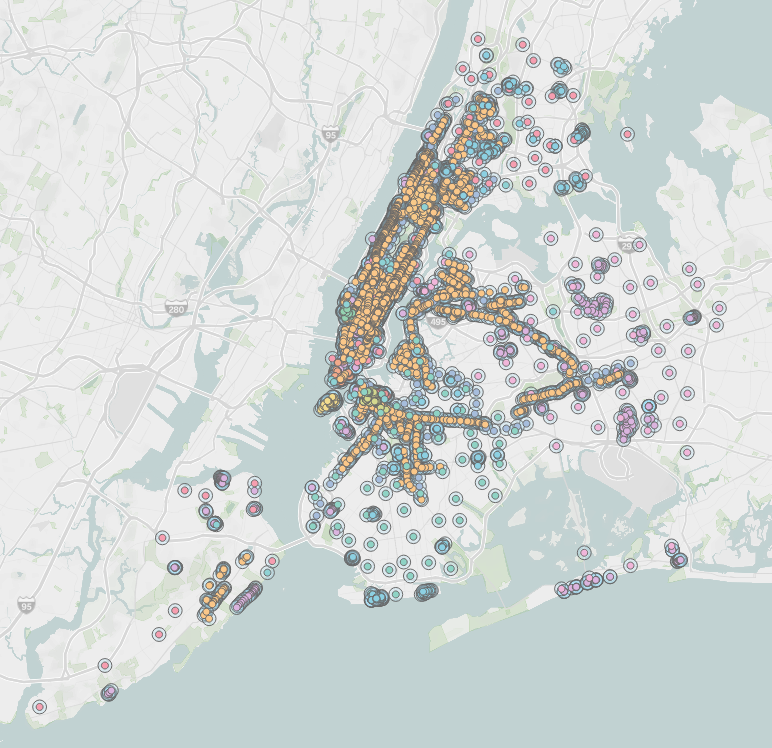
Here’s what it looks like with a distance of 1500 feet:
This can be very useful when considering spatial joins in Tableau or seeing if an area INTERSECTS() with another area. Buffering can be a good thing!

Icon used - loading circle