


Then you’d better go catch it!
Understanding how parameters can be used will increase interactivity, so as follows are a few examples.
1. Using Parameters as a Visible Component of your Chart
1a. Top N, Dynamic Reference Line
1b. Dynamic buffer zone (my blog post on that)
2. Parameters that Change the View
2a. Chart Swapping with Parameters
2b. Measure/Dimension swapping with parameters (my blog post on that)
3. How Parameter Actions Can be Used
3a. Changing parameters with a click of a chart
3b. Using Dynamic Zone Visibility (my blog post on that)
In Tableau, parameters are variables that allow people to interact with your viz. They can be incorporated into a viz at different levels of complexity.
Fairly simple is incorporating parameters as a component of your chart - such as showing only Top N (Kinley wrote on this topic). You can combine a parameter with calculated fields to make your charts more dynamic, like these examples of a dynamic reference line: 1 by John Power, 2 by Flavio Matos.
Slightly more advanced is using parameters to swap charts (Sadiya wrote this post on how).
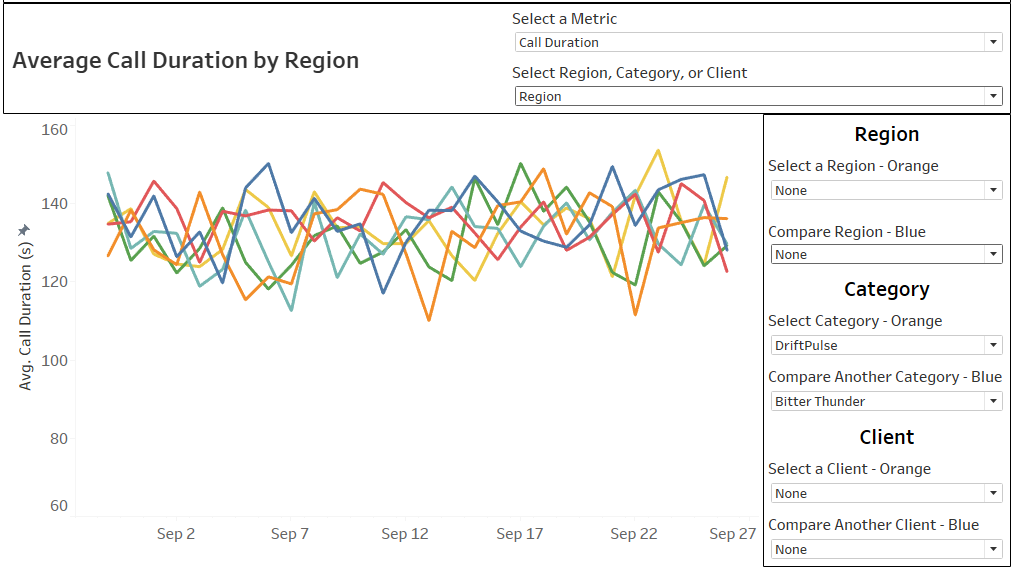
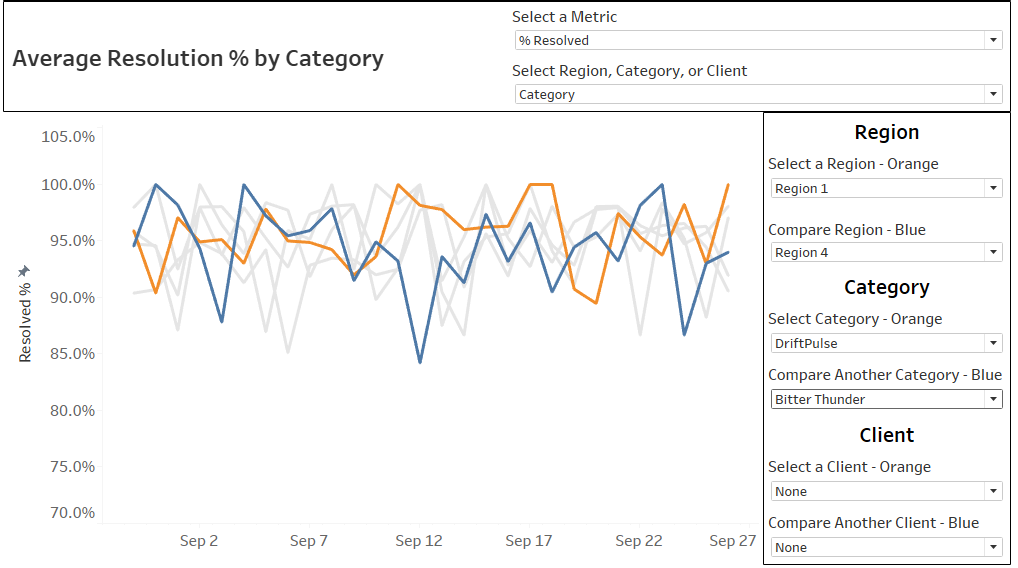
This is a technique I’ve used most heavily in a Customer Service KPI Dashboard I made all the way back in Week 2.
It allows you to choose the metric, the detail the lines are broken out by, and then to highlight a maximum of two lines to compare.
In addition to swapping charts, parameters can be used to swap dimensions and measures within the same chart: a how-to by Carlo Sanzeri.
I talk about metric/dimension swapping in this blog post, working off the same chart I made in Week 2.
For all of the options we’ve seen above, the parameter is visible on the side and is controlled by a drop-down menu. Using Parameter Actions, you can select or click on a mark to change a parameter almost “in the background” of your dashboard.

To build this parameter action, you need to have the exact data type and parameter option within the sheet you want to use to change the parameter.

Since this parameter is a String type, and the parameter options are “Sales” or “Profit”, we need a string that says “Sales” within the Sales sheet, and a string that says “Profit” within the Profit sheet.

The “Sales” string is on detail and is not visible on the sheet.

On your dashboard, go into the Dashboard menu on the top, then find Actions near the bottom. It will open up this menu, you will want to add an Action to Change Parameter.

The source sheet is where we are clicking to change the parameter. The Target Parameter is the parameter that we want to change. The Source Field is the “Sales” string from earlier.
This Action is then saying: when I select on the Sales sheet, change the Sales or Profit parameter to “Sales”.
Then we build another Action for the Profit sheet.
Parameter Actions can be combined with Dynamic Zone Visibility to not only change parameters, but seemingly navigate to another dashboard! More in-depth in my blog post about using dynamic zone visibility for Dashboard Week.
Another way I like to use parameters and parameter actions is incorporating them into a filter or sort. In this sample dashboard I created, clicking on one of the big numbers at the top will filter and sort the results on the bottom differently.

Here’s my filter - when the parameter changes, so does the filter.
Thanks for (para)meter-reading my blog!