During 17 weeks of training in the Data School, progress can be measured by the Alteryx tools you’ve learned to use, or the Tableau charts you now know how to build; however it’s not something we explicitly measure.
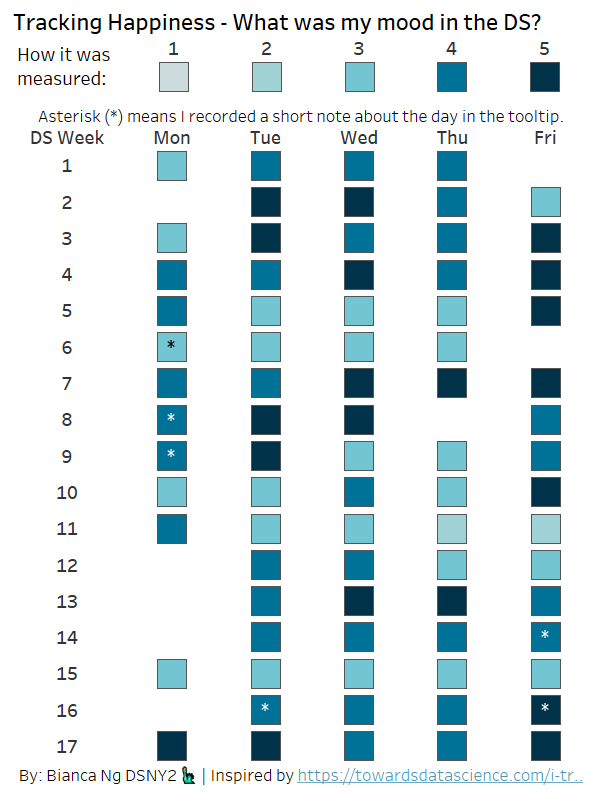
I decided to track something for myself throughout these 17 weeks, and landed on tracking my mood while in the Data School (inspired by this article). I highly recommend future Data Schoolers do the same and then get a big picture view of the time spent in training at the end!
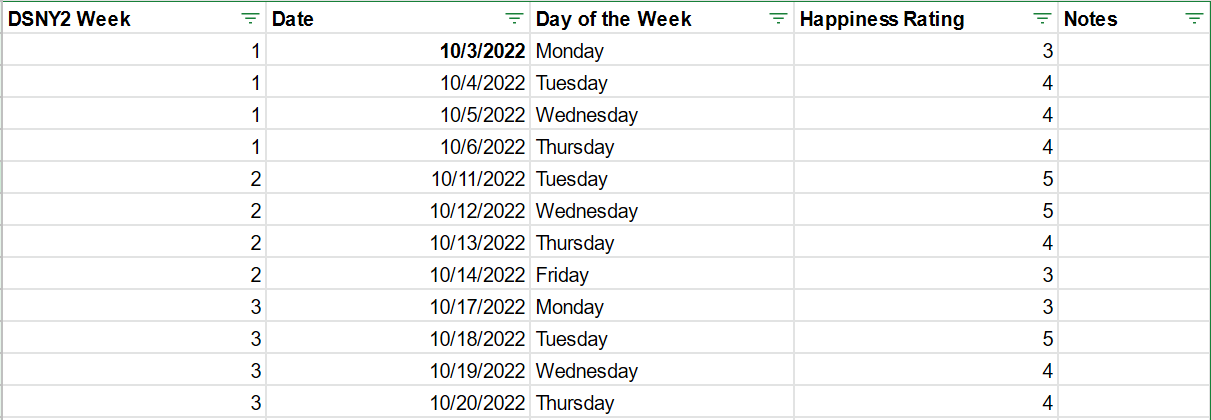
I recorded each day in Google Sheets, and here’s how I set it up:
I filled in the first cell of the date column with the start date, then subsequent dates - taking into account weekdays only - were filled in with this formula:
=B5+IF(WEEKDAY(B5)>5,3,1)Replace B5 with the cell of your start date.
I ended up removing any rows where I took PTO or there was a holiday, but as that’s a manual process, it’s fine to leave them in and keep the tracked value as null.
For DS week, I used the WEEKNUM formula. It gives me the number of the week out of the entire year for the week; 10/3/22 is the 41st week of the year, so I subtracted 40 to get the DS week. The 40 being subtracted will be different depending on when your DS cohort starts. This formula also does not take into account cohorts that cross over two years (like mine, which was from Oct 2022 - Jan 2023).
=WEEKNUM(B5) - 40The below formula does take into account chorots like mine that cross over two years; the 40 and 13 may need to be fiddled with for other cohorts.
=IF(WEEKNUM(B5) - 40 < 0, WEEKNUM(B5) + 13, WEEKNUM(B5) - 40)I have a Day of the Week field, but this is not necessary and can also be done in Tableau with the Date field.

For DS Week and Date, drag these down to your last day of training.
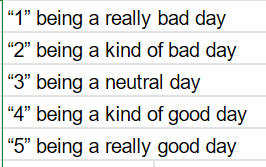
The next column, Happiness Rating, is what I tracked. You can track anything, on any scale. Just be sure to keep it consistent. Here's the scale I used (same from the article linked above).
The last column is where I included any notes about the day - sometimes I wrote a little note as to why it was particularly bad or good.
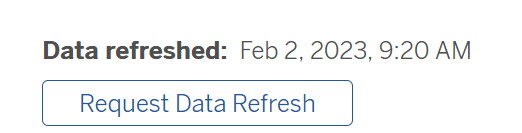
I connected to this Google Sheet directly in Tableau Desktop so any future updates I make to the sheet will be automatically reflected in the viz.
In the Data Source pane, connect to a Server, then select Google Drive. You'll have to log into your Google Account to authenticate. While on your viz on Tableau Public, you can request a refresh in the bottom right.
Here’s the final product on Tableau Public for now - I might do a little more on this. 😉