


Alternative Blog Title: Beginning of the End, Day 3 🔥🔥🔥
For day 3 of Dashboard Week, we used the Rick and Morty API. I am familiar with the show, but had missed the day of training spent on APIs, so Liam's blog post about this specific API was very helpful.

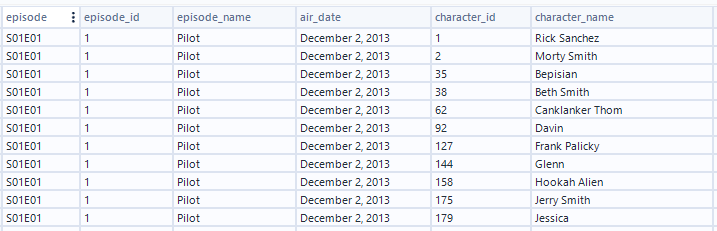
My Alteryx workflow started by grabbing the endpoints of the API - one for each “dataset”: characters, episodes, and locations.
I chose to only work with characters and episodes.


I joined the data on character id to create a dataset that had each character appearance per episode.
For the dashboard, I started by focusing on the 5 main characters of the show - the Smith family. Due to my insider knowledge of the show, I know that Rick and Morty frequently travel to other dimensions and interact with other versions of themselves. That directed me to counting just how many Jerrys, for example, appear in 5 seasons of the show.
Because I also know that the ways they interact with other versions of themselves is often violent, I was curious about their statuses (dead or alive…). I’m also curious about the cause of deaths of their other selves (whether themselves or some other factor), but that’s not in the data. 🔪


The last portion of my dashboard needs a little work - there was some primary and secondary sorting I wanted to implement but couldn’t get the calculations right for.

Depending on the selected character, I wanted the highest percentage of that character in an episode to sort to the top of all episodes, and also for the inner sort within characters.
In addition to working on the sort, I’d also like to focus on aesthetics first next time - see Erlina, Elaine, or Annie’s dashboards for today as an example, or to successfully use the new image role function like Annie, Kinley, or Juliet. 😉 (I kept getting the light gray square icon, but that may have been a Tableau Desktop issue and would have probably displayed on Tableau Public, as it did for Annie.)
Just two more days of dashboards left…