


Last week, DSNY13 was given a simple task: pretending that we were taking over an (unreachable) previous consultant's work, we were to build on another cohort member's work with only the documentation they had made available to orient ourselves.
Luckily, we had attended each other's presentations of these deliverables the week prior, but too soon I realized that relying on my memory for the details of the project I had to build off of wouldn't do. And with that, it hit me: the coaches weren't kidding, proper documentation is a must.
Whether working for an imaginary, internal, or actual client, a consultant's time with a project is limited, their memory can only hold so much information for so long, and answering questions on what you did and how you did it after you've submitted and finalized a project is probably not the best use of your time. I knew all of this intellectually, but being on the receiving end of insufficient documentation made all of these take-aways much more real than any level of repetition ever could.
I'll admit that as I went along piecing together the project story and building on it, I had to catch myself before complaining about the missing documentation. I'd be lying if I said I had put whoever was assigned to my prior project in a better position than I was in.
So, here's four things I've learned are essential to keep a record of while working on a project.
Data Transformations
In general, I'm more of a writer than a sketcher, but regardless of the format, keep track of the transformations you apply to your data. It is often helpful to map out a plan to get your data in the right shape, but I'm more referring to recording the actual changes you make to the data table(s) you are working with. This can mean renaming your clean steps in Tableau Prep and adding descriptions, or renaming your steps in Power BI to be more informative. You could also create a document listing the steps you're taking and your reasoning for them–this might be particularly helpful for more complex transformations, such as pivots or joins. Speaking of joins, make sure to specify your join key and the cardinality of any relationship, which brings me to the next point.
Data Schema
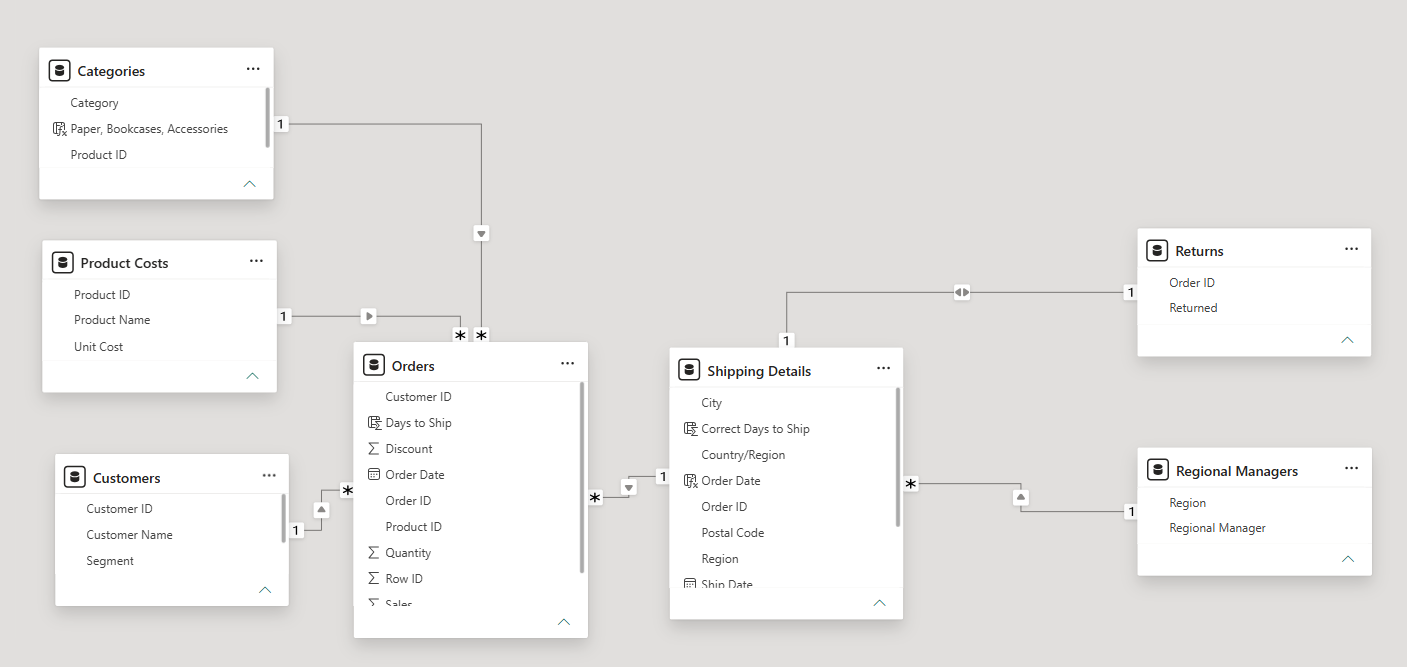
Schemas are meant to illustrate the connections in your data. That means you shouldn't construct your schema without having a good grasp on how the different tables relate to each other. Besides the links that exist, you should be familiar with the meaning of a row in each table that you're working with. With that, go ahead and simply list your table headers, followed underneath by their respective fields, and add arrows to indicate the relationships between the fields in different tables.
The example below (from Power BI's Model View using the Superstore dataset) is a great standard: it lists all the existing tables as separate entities, the table fields, and illustrates the cardinality (one-to-many, one-to-one, etc.).
Concept Sketch
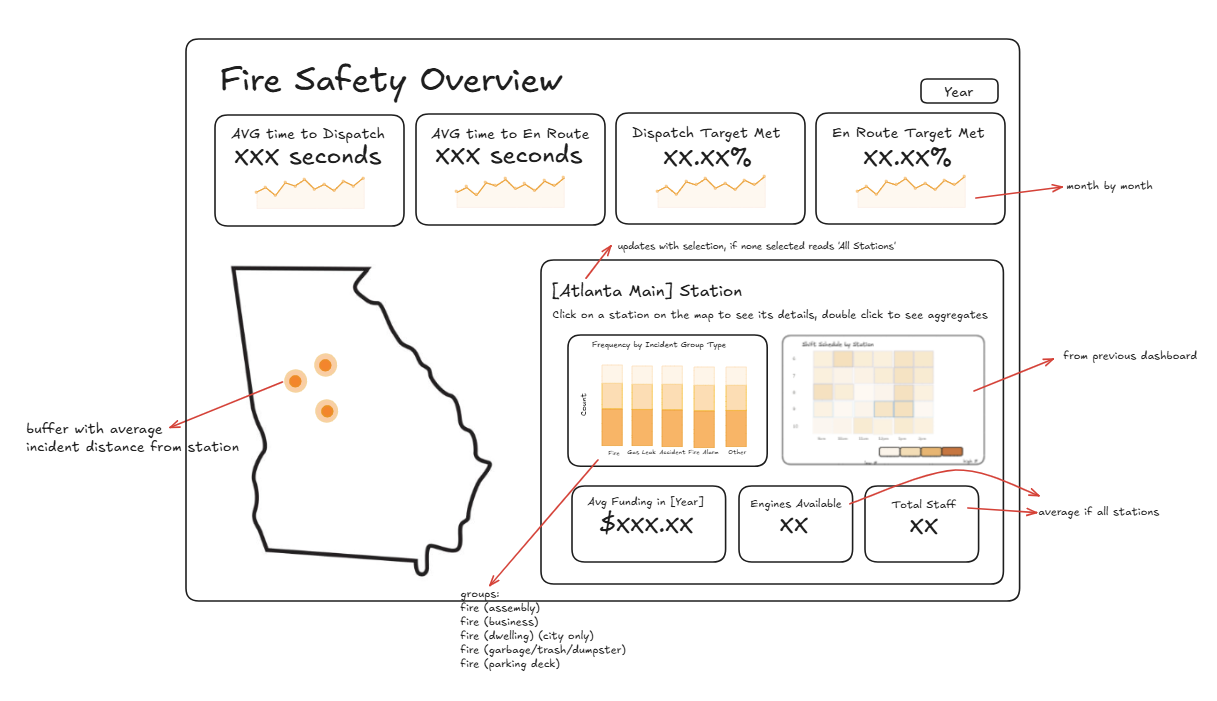
A dashboard/visualization concept sketch has two main tasks. First, to put you and your stakeholders on the same page regarding the work you'll be doing and the deliverables you'll be handing over. Second, to make your job easier when it comes time to actually build your dashboard/visualization. So include any/everything that aligns with these goals: layout, containers, chart types, axes values/labels, color scheme, etc. I tend to enjoy making these by hand, but using a platform like Excalidraw allows you to easily share a screenshot or do a walkthrough with others.
Here's an example of a dashboard concept sketch I built:
Questions/Decisions
Project logs may seem annoying to complete, but filling them out really only feels like a hassle if you wait until the end of the project to tackle them. If you fill it out as you go, even just writing key words/phrases for each section, you'll find that project logs are much more helpful than they are troubling. When done right, project logs give contributors crucial information to be able to understand, reproduce, and/or scale a project.
Here are some sections I would recommend including: Overview, Stakeholder, Background, Objective, Deliverables, Data, Software Used, Work Done, Impact, Client Feedback, and Next Steps. You can also include a personal reflection on challenges and successes. Do your best to strike the right balance between being detailed and concise in your log.
Bonus: keep a tidy file structure
Basically, don't save all your files to your Desktop. Neatly label your files and folders, and organize them so that future you (or someone else) will be able to seamlessly access what they're looking for.
Follow these documentation habits and your projects will be easy to track, reproduce, and hand off.