What is an API?
Applications can integrate and communicate with one another more easily thanks to application programming interfaces. Consider them as links that give programmers access to and use the features of different software packages, services, or systems. They are routinely utilised in the background of social media applications, looking up the weather, or even exchanging instant messages.
An API works by sending a request to a server, which responds with information. The way that different APIs operate can vary, and occasionally the data that is delivered requires more processing. Additionally, the data is frequently transferred in forms like JSON, which makes parsing and processing necessary for efficient utilisation.This is where Alteryx flows can come in use.
How to Connect to an API:
In this blog we will be using the Police Crimes free API, this will show how to access across multiple web pages, as well as using spatial data. I recommend always having a read of an API's Documentation to help add some clarity. You can access the Police Crimes Documentation here: https://data.police.uk/docs/.
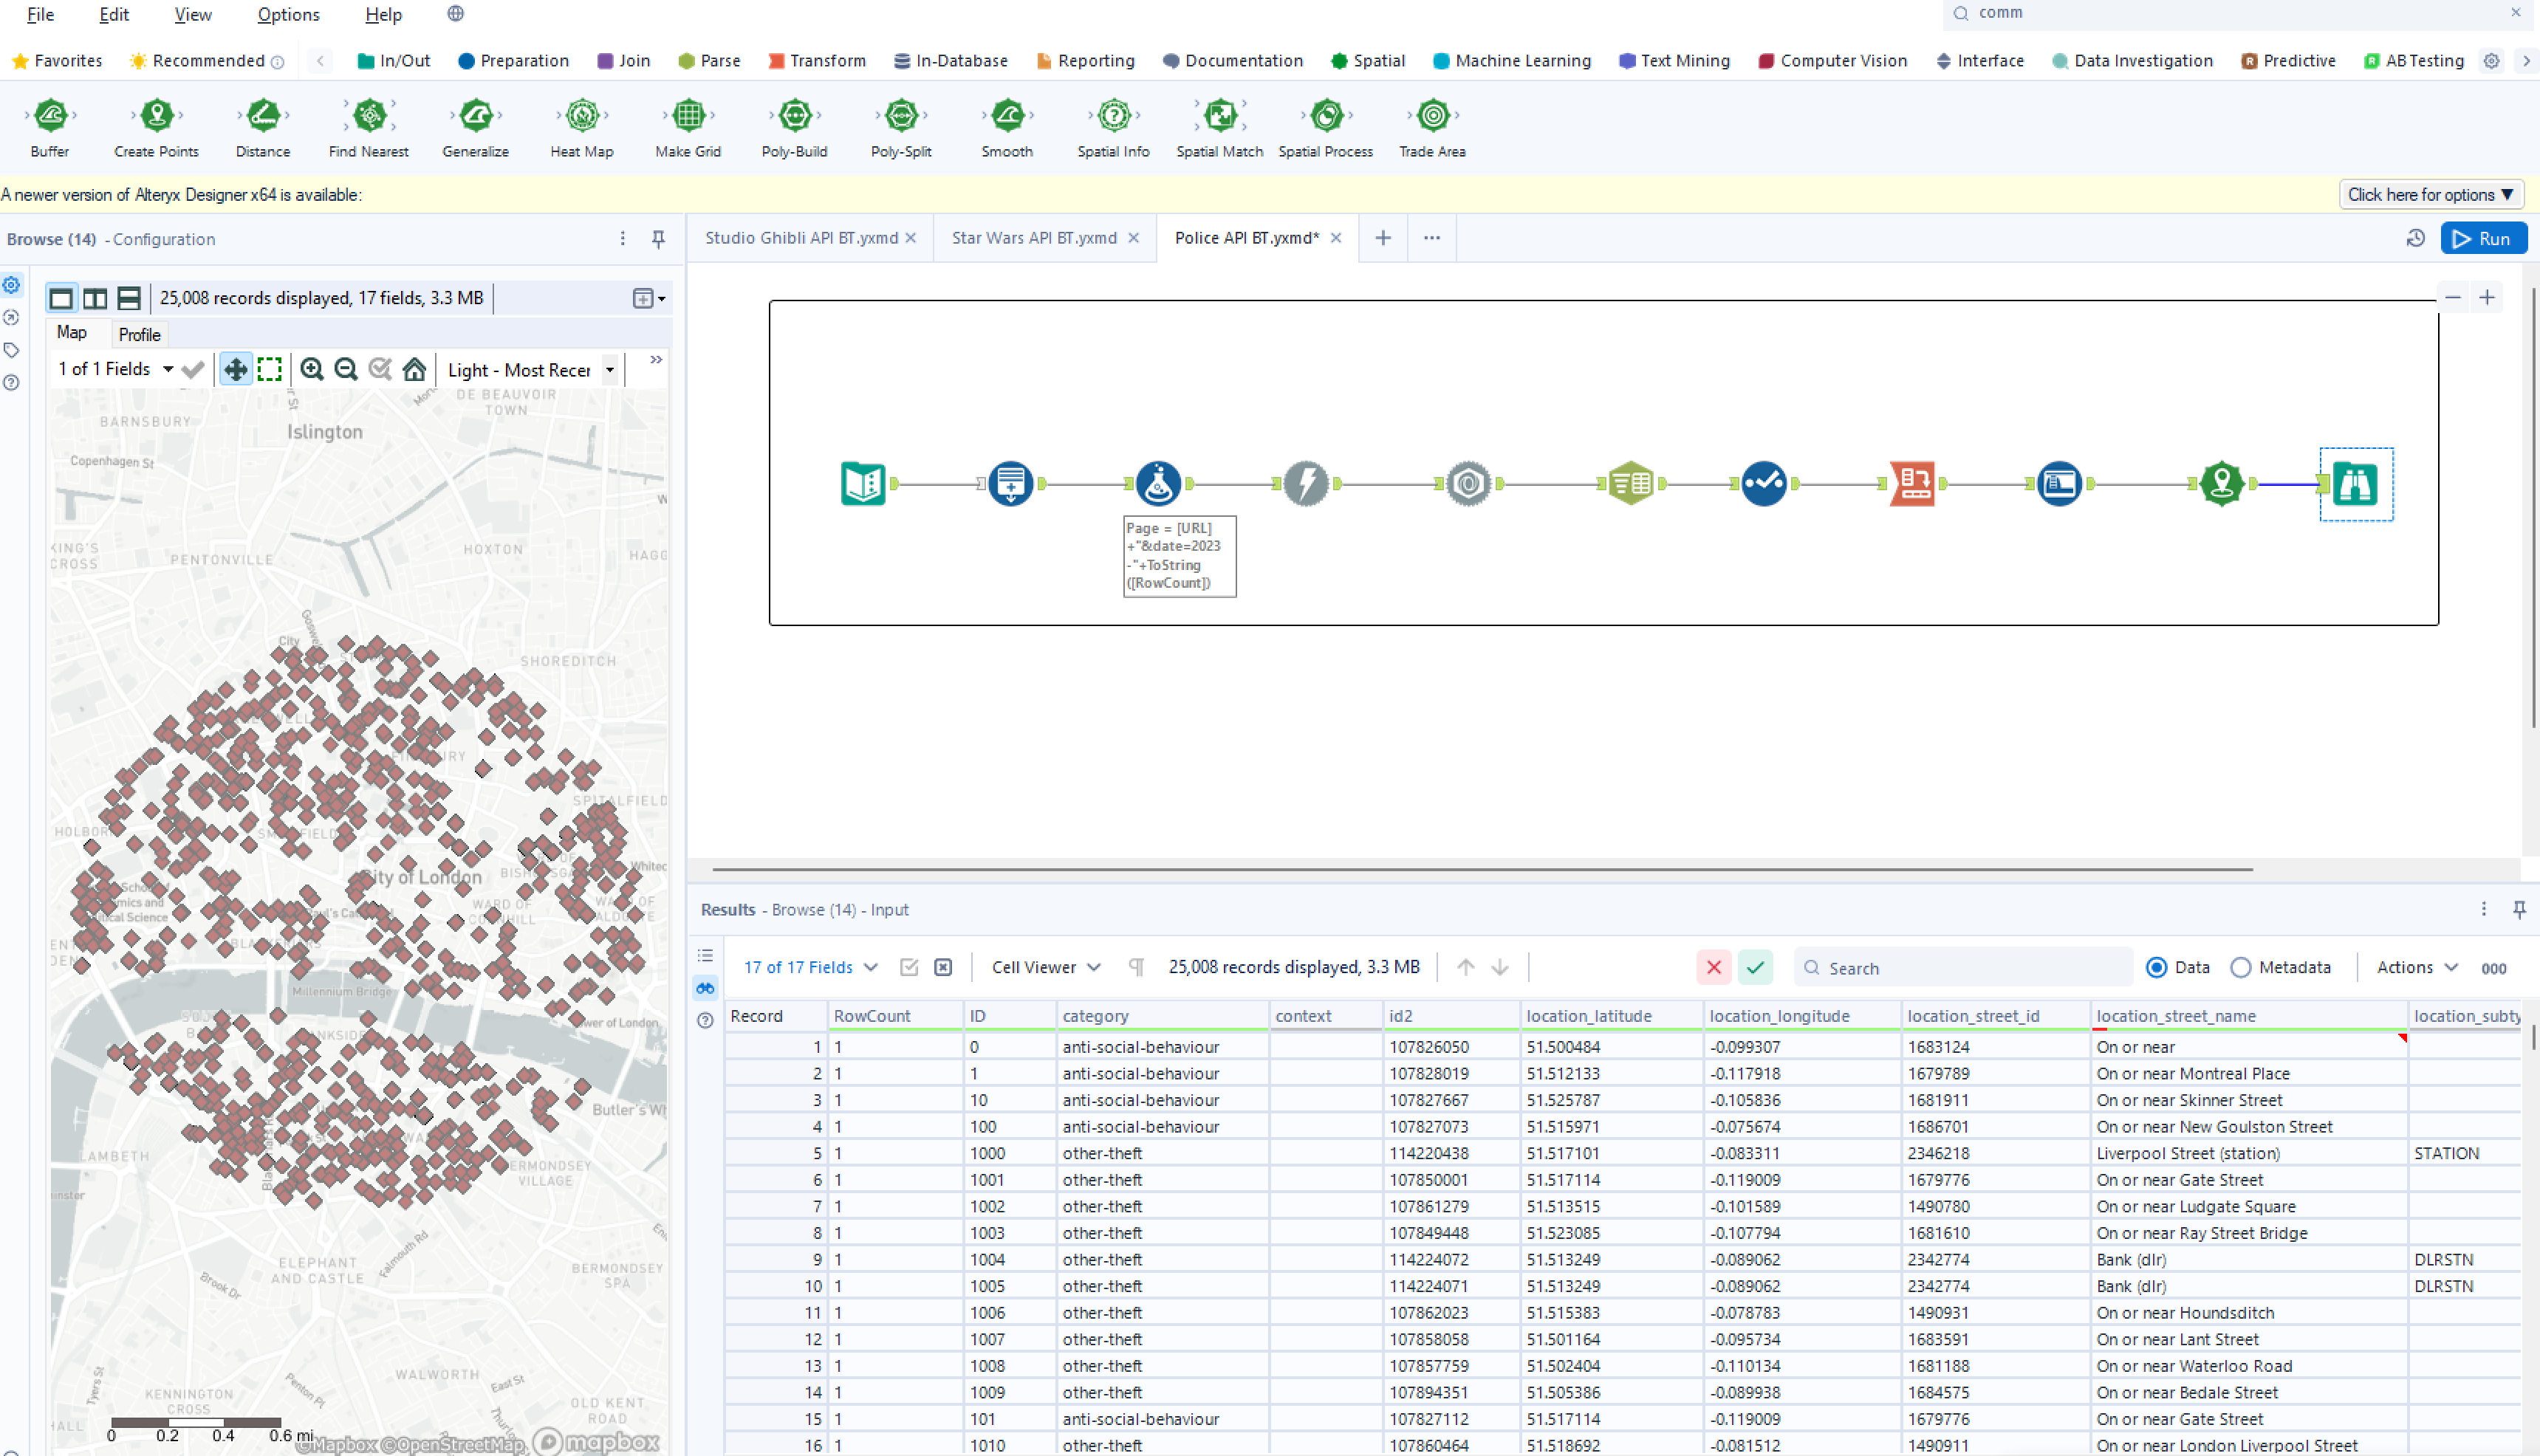
Our final flow will use 10 tools, resulting in an output below, showing each row being one reported crime, as well as a map showing the locations of them:
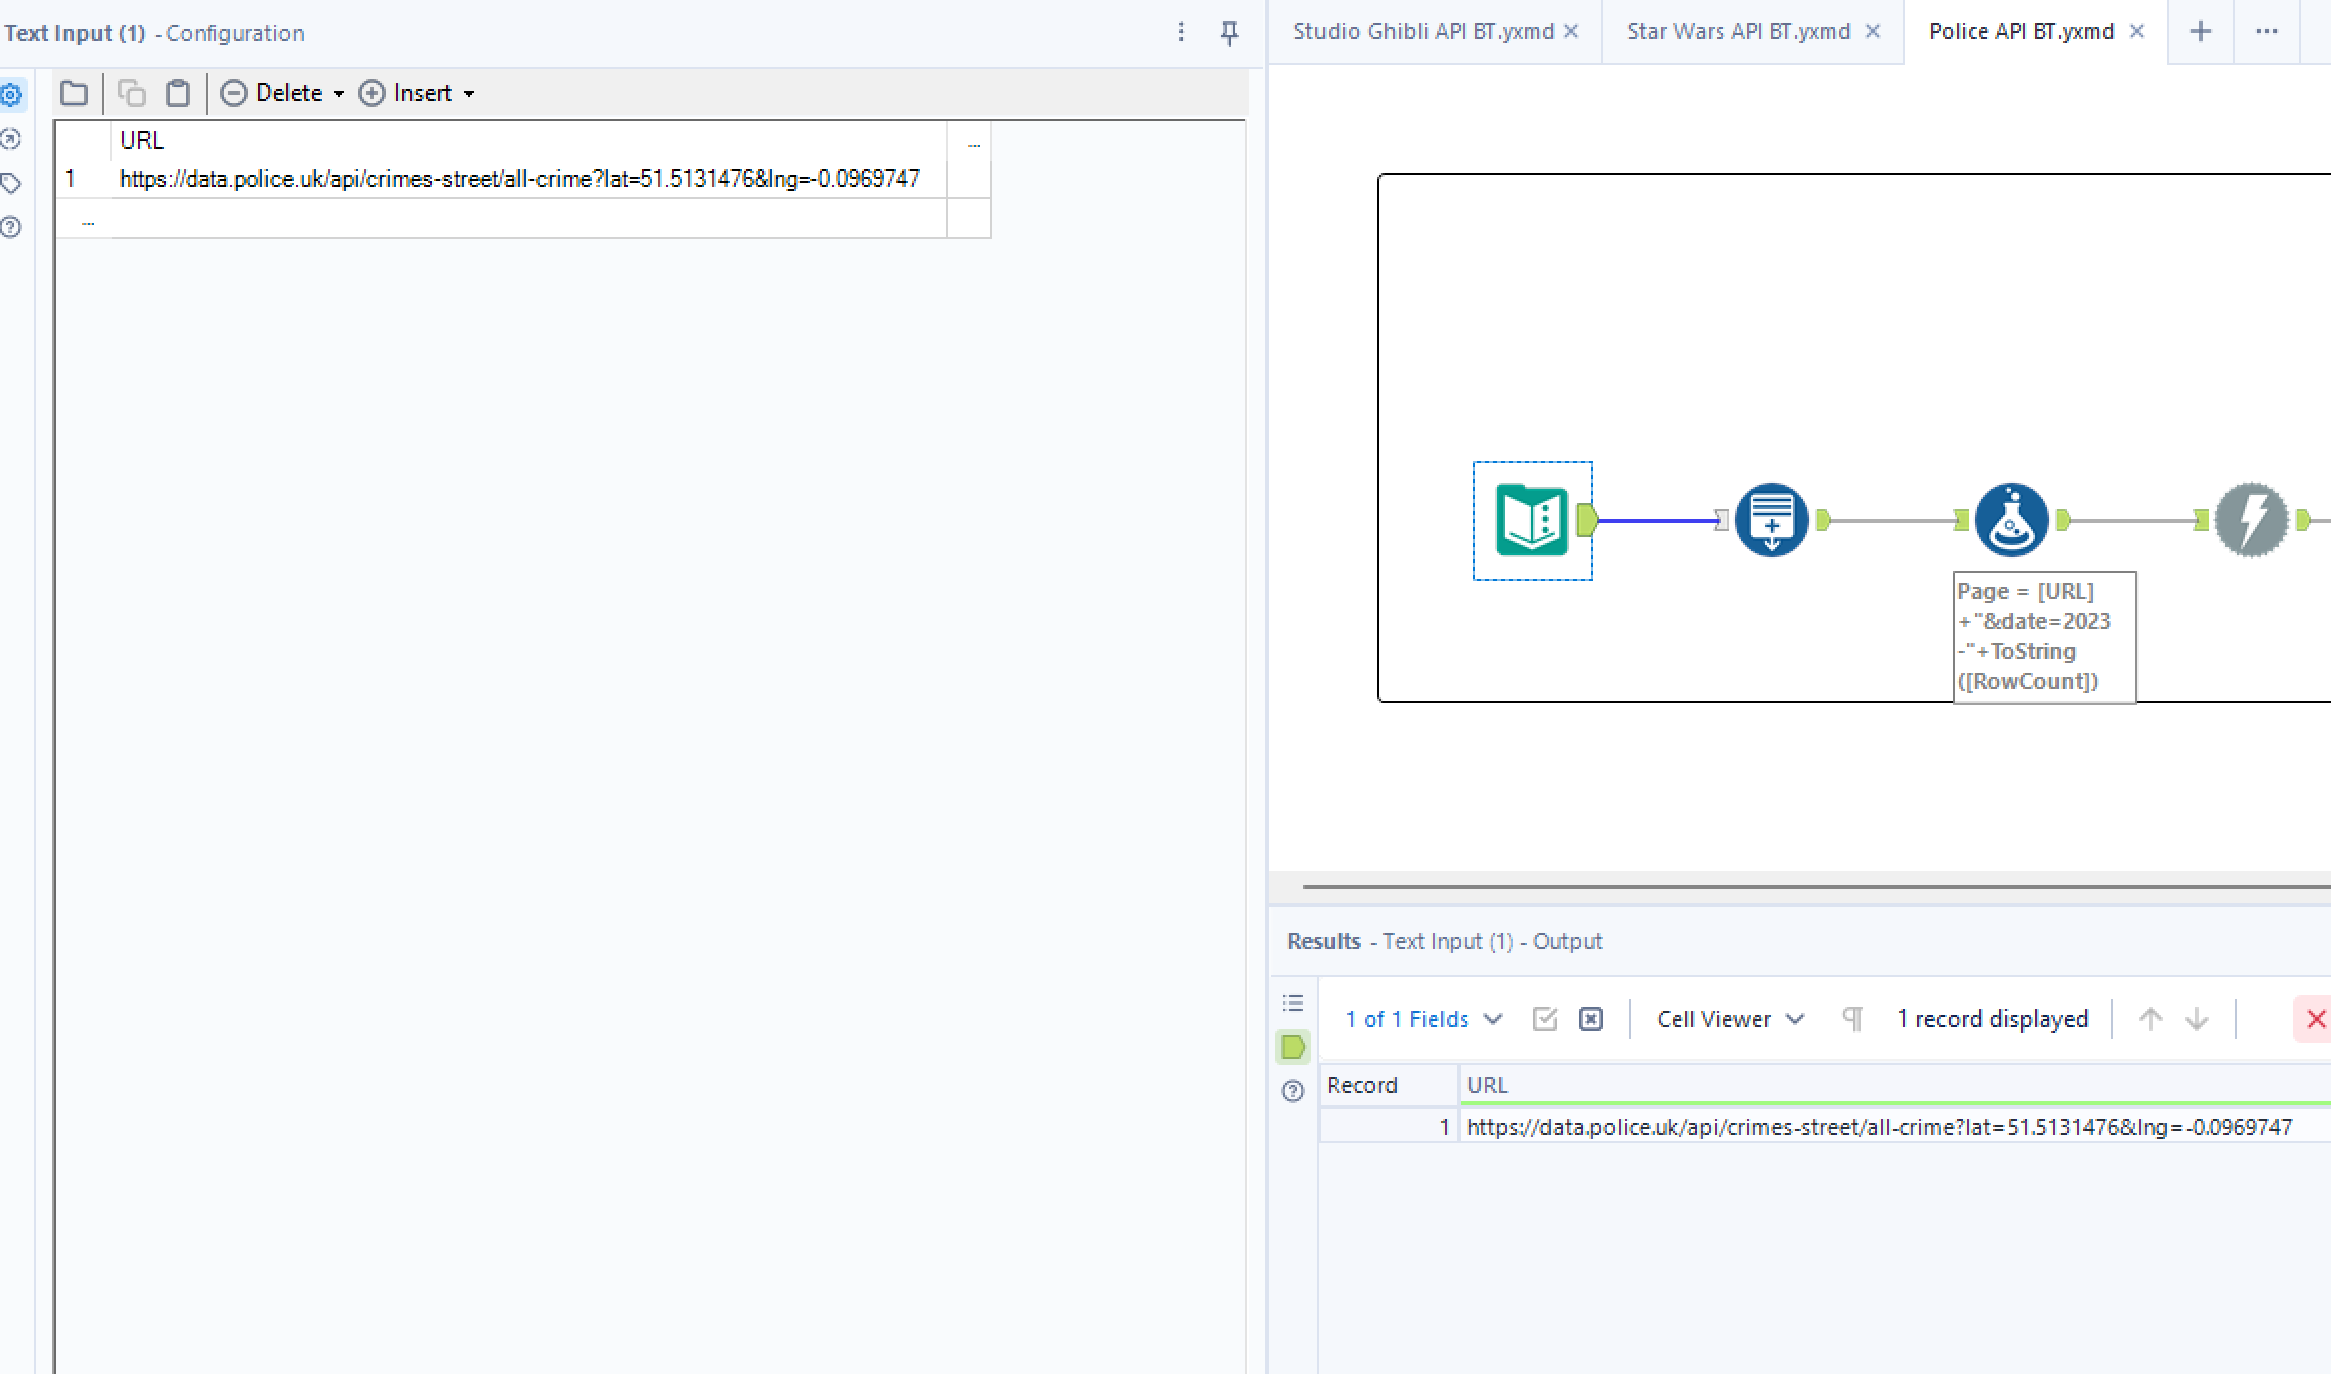
Step 1: Text Input tool to enter in your API URL:
Use https://data.police.uk/api/crimes-street/all-crime?lat=51.5131476&lng=-0.0969747 to follow along. Rename the Field 'URL'.
Step 2: Generate Rows tool to create 10 additional rows in order to capture the 10 pages later on in the flow.
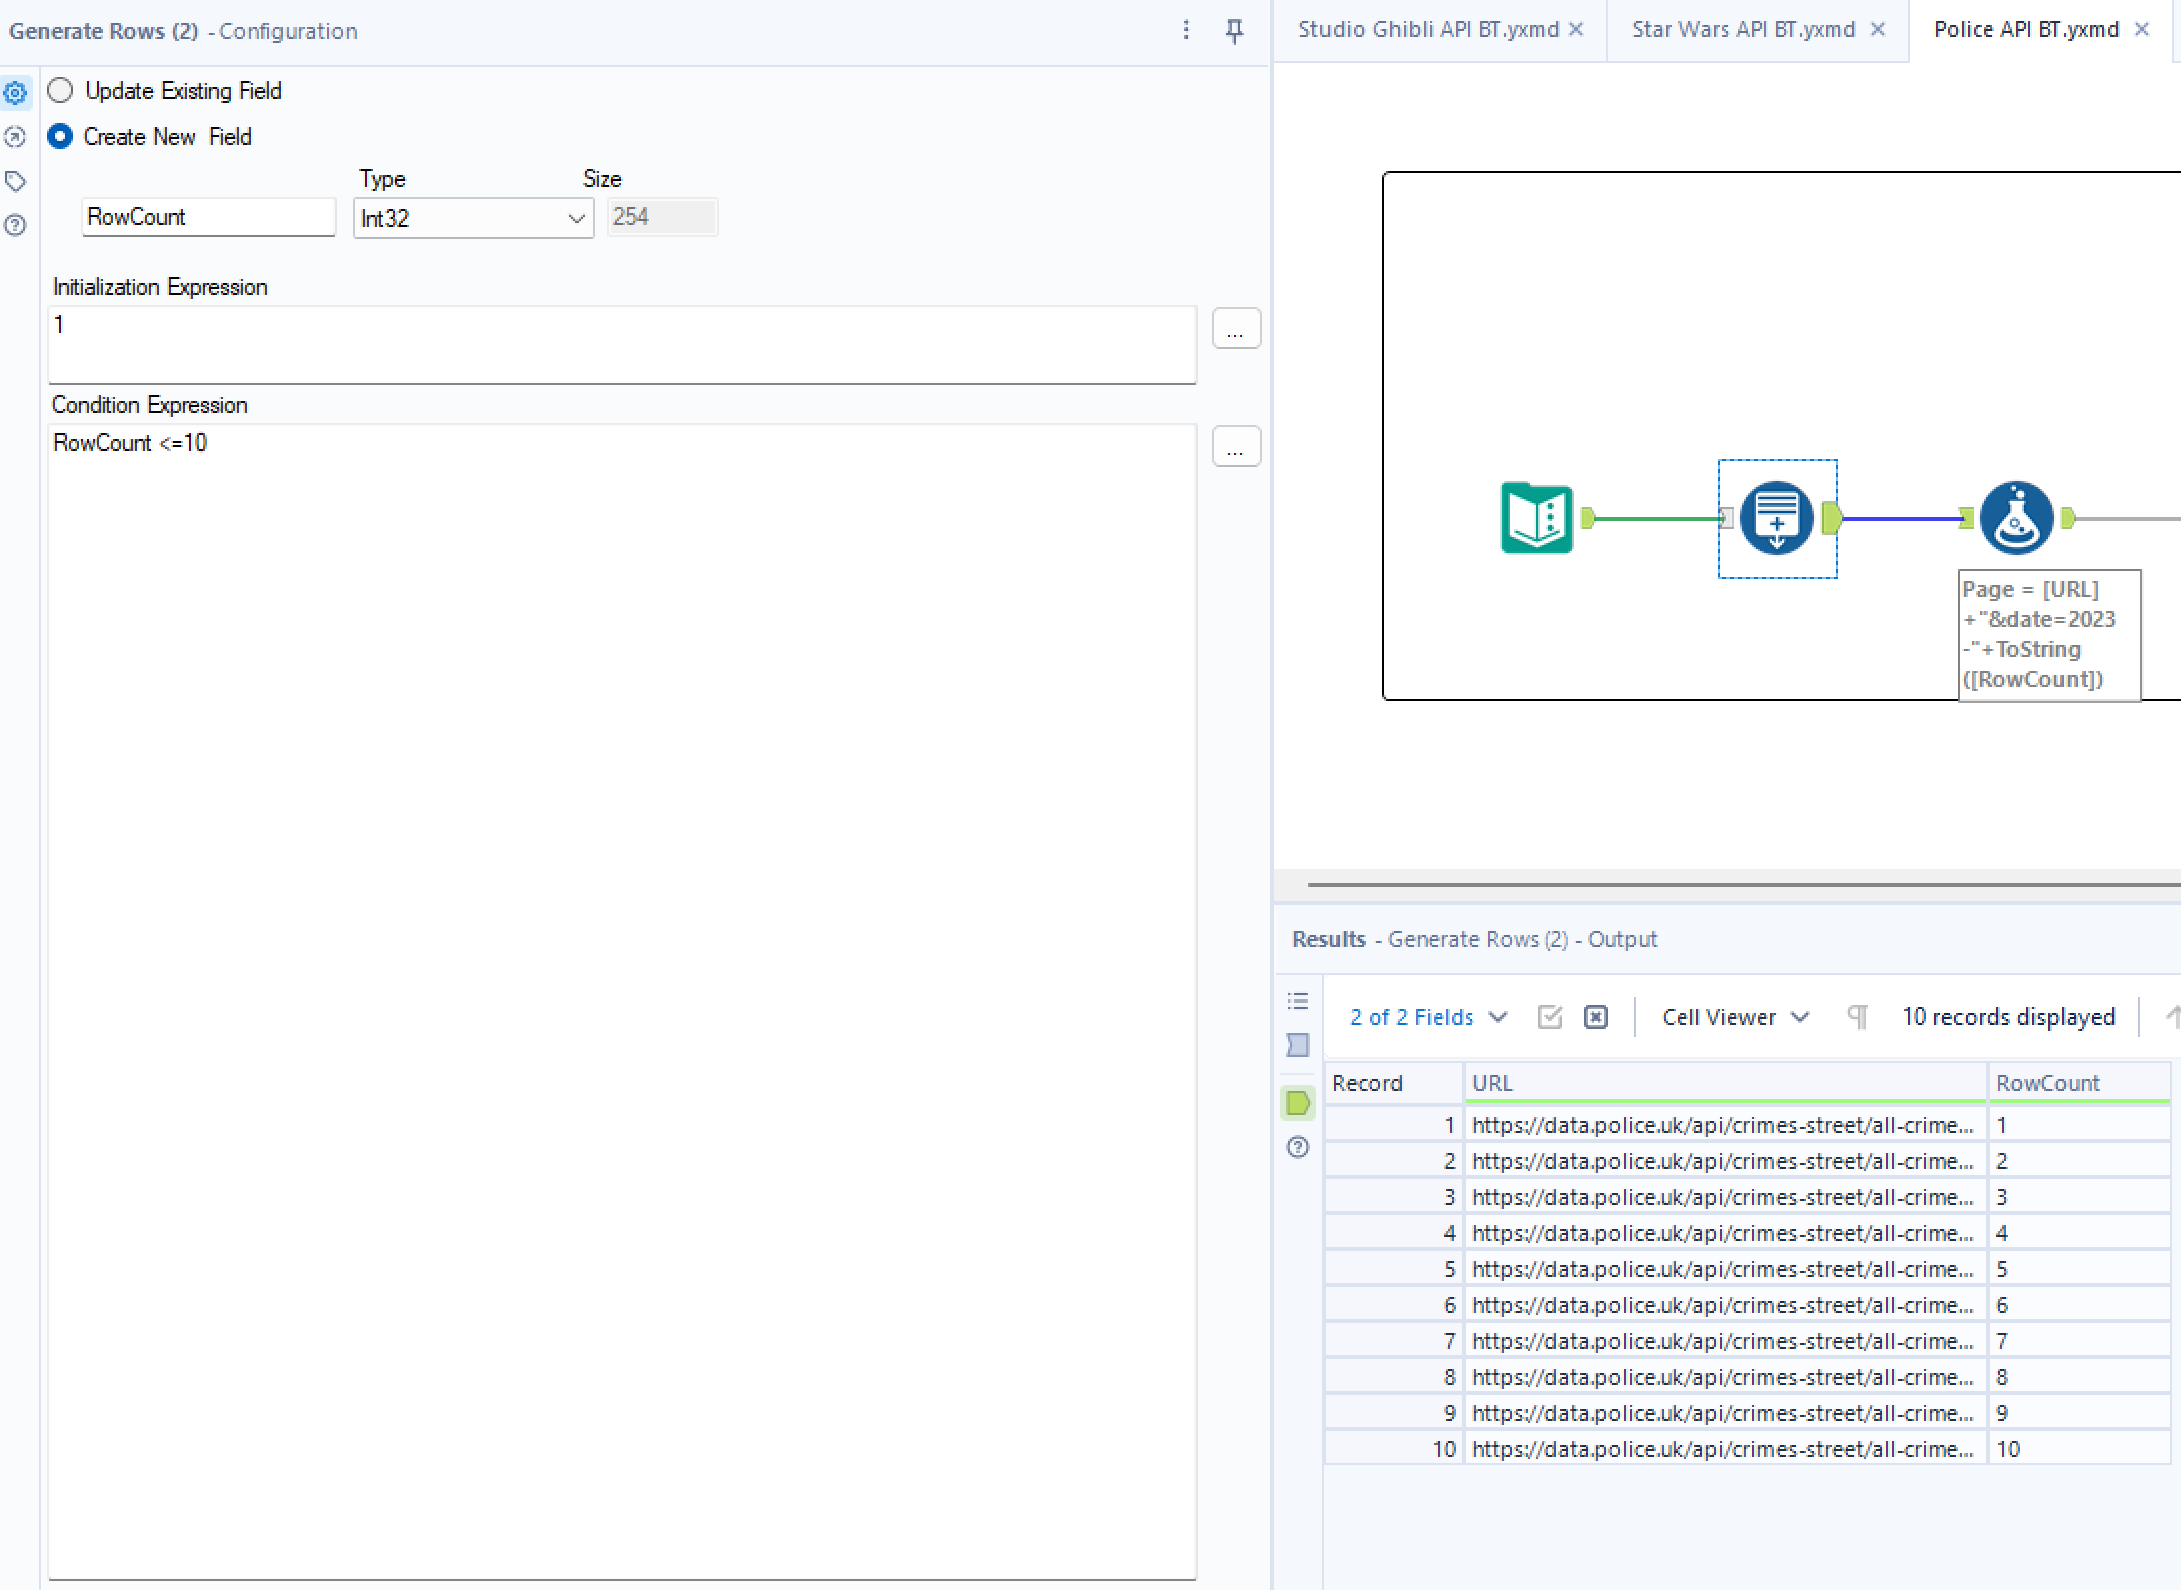
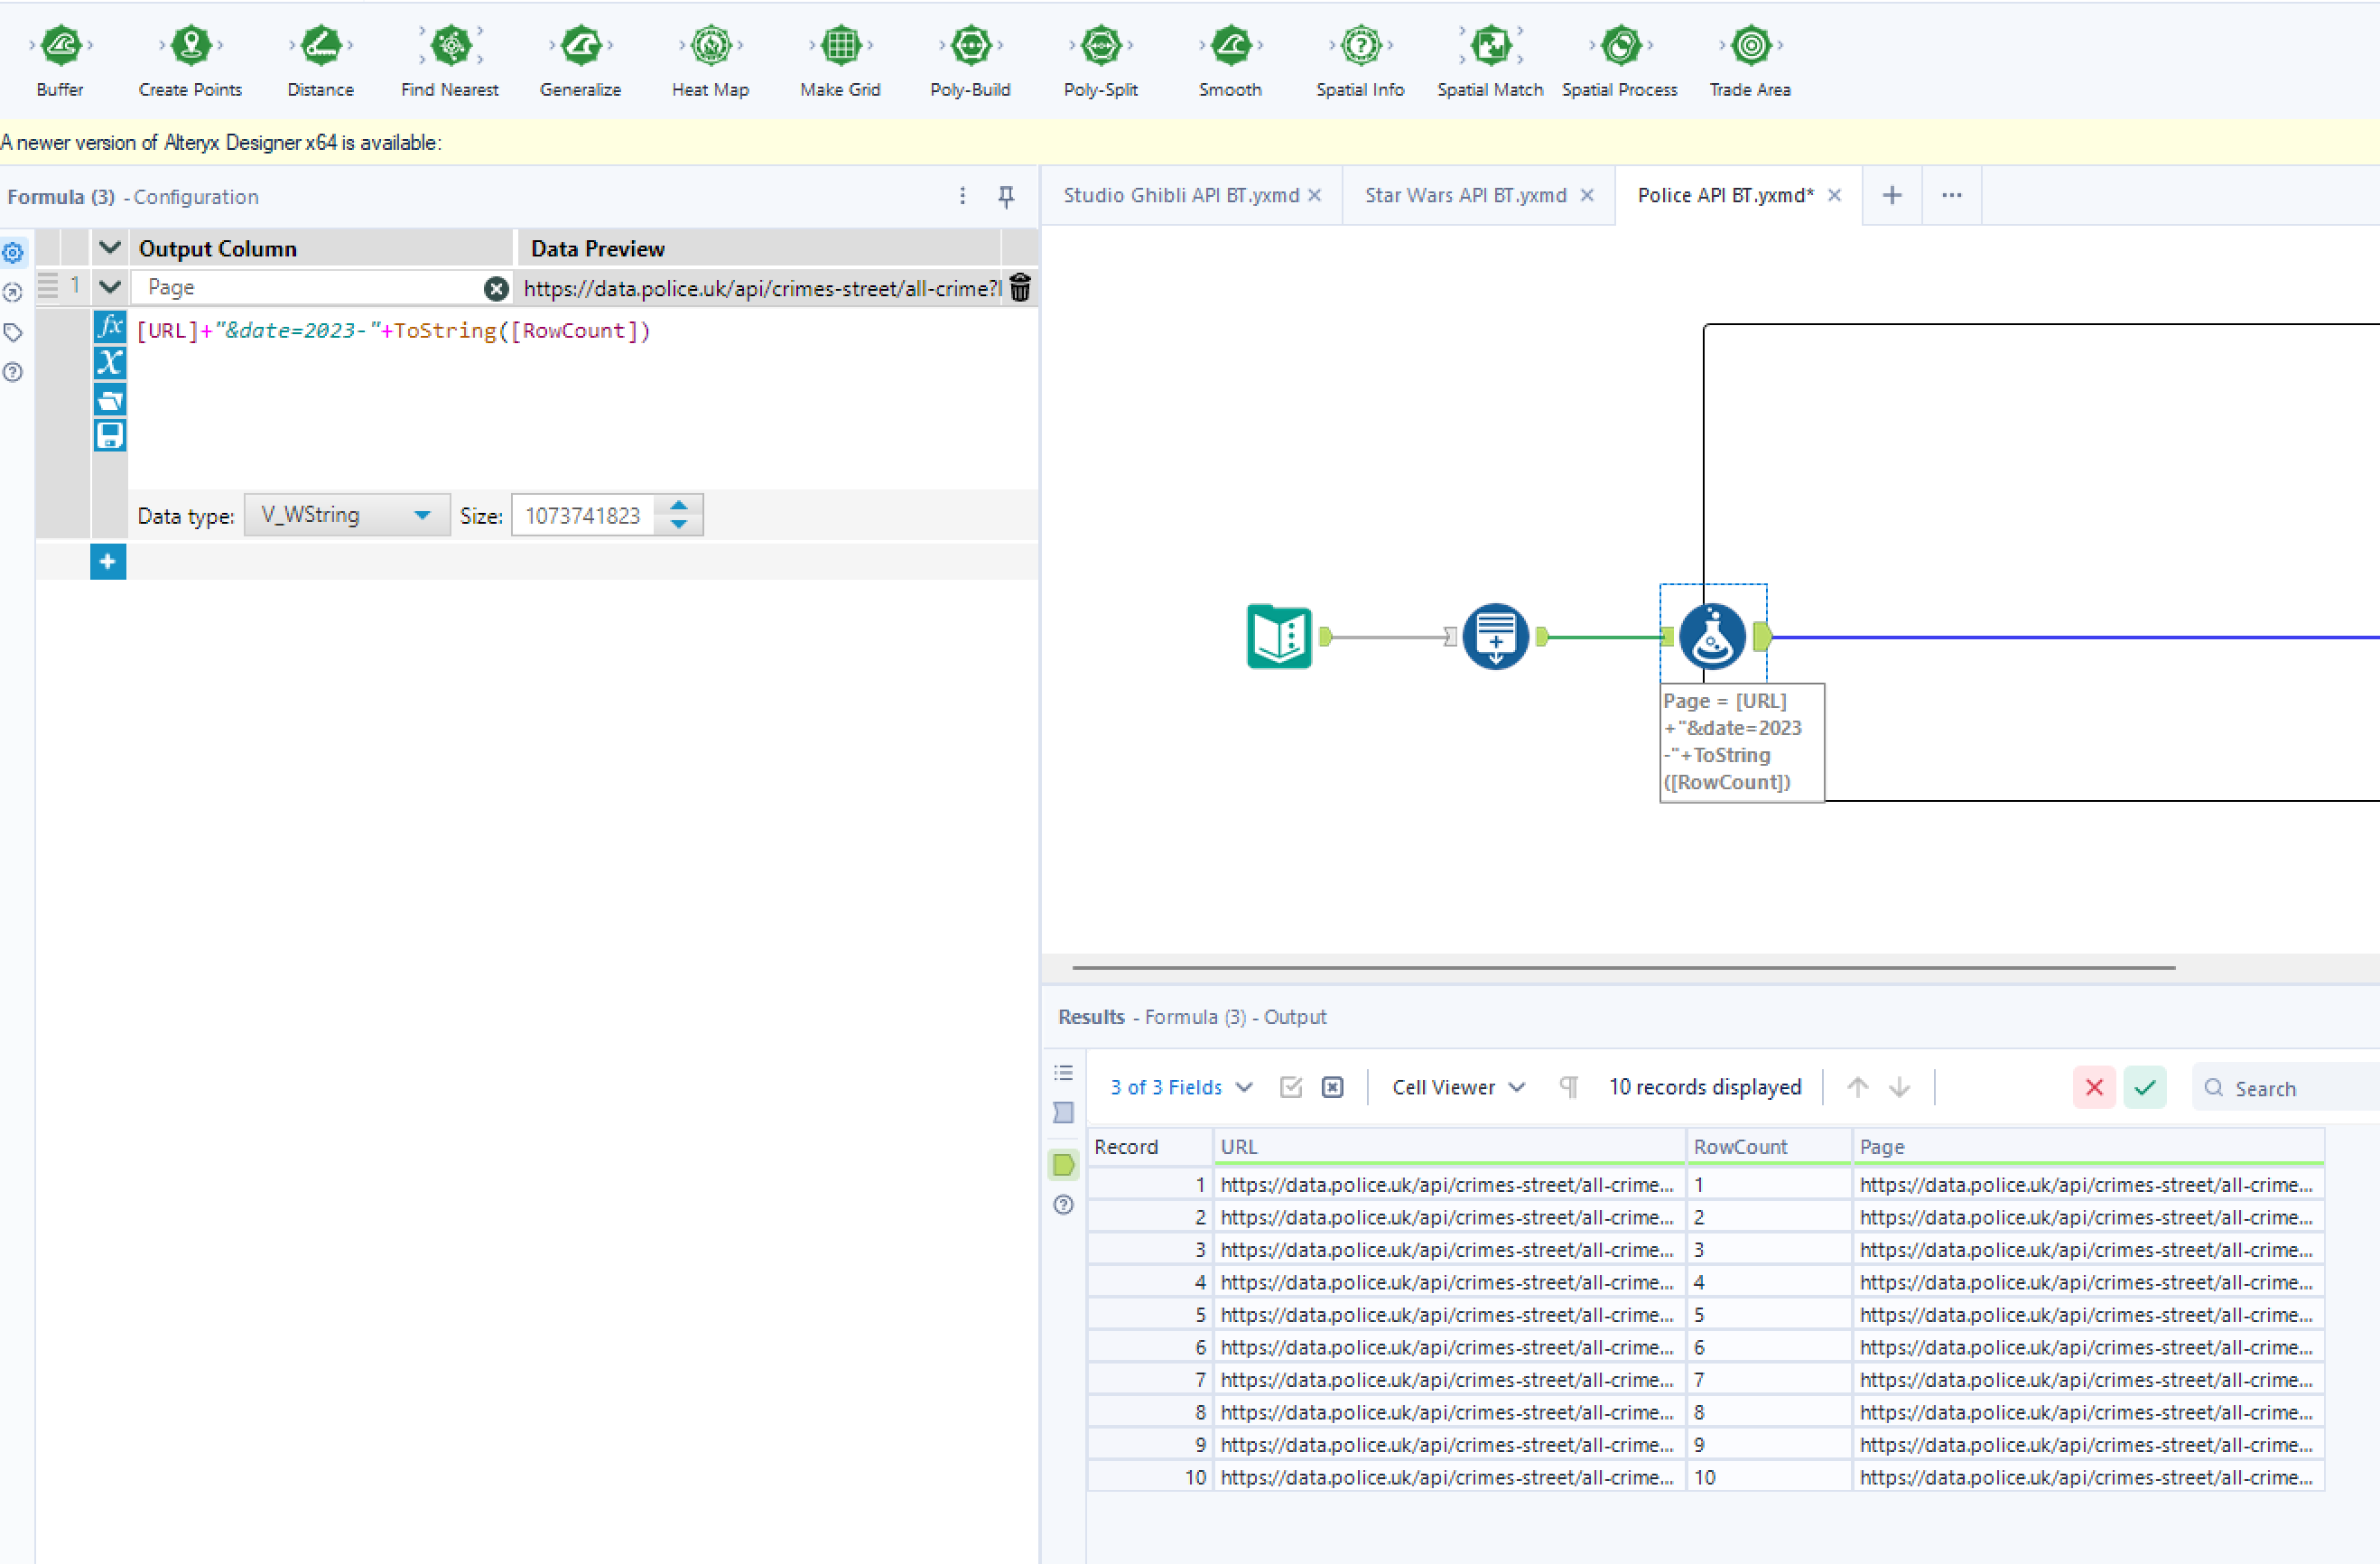
Step 3: Formula Tool to concatenate the date we want to filter drawing information out from and the row count to the end of our URL to form a new URL specific to each page we want to draw information from. I'm naming this new field 'Page'
p.s 'ToString' is wrapped around RowCount as to be able to concatenate in this way they must all be of the same data type as each other, so the row count is changed to a string.
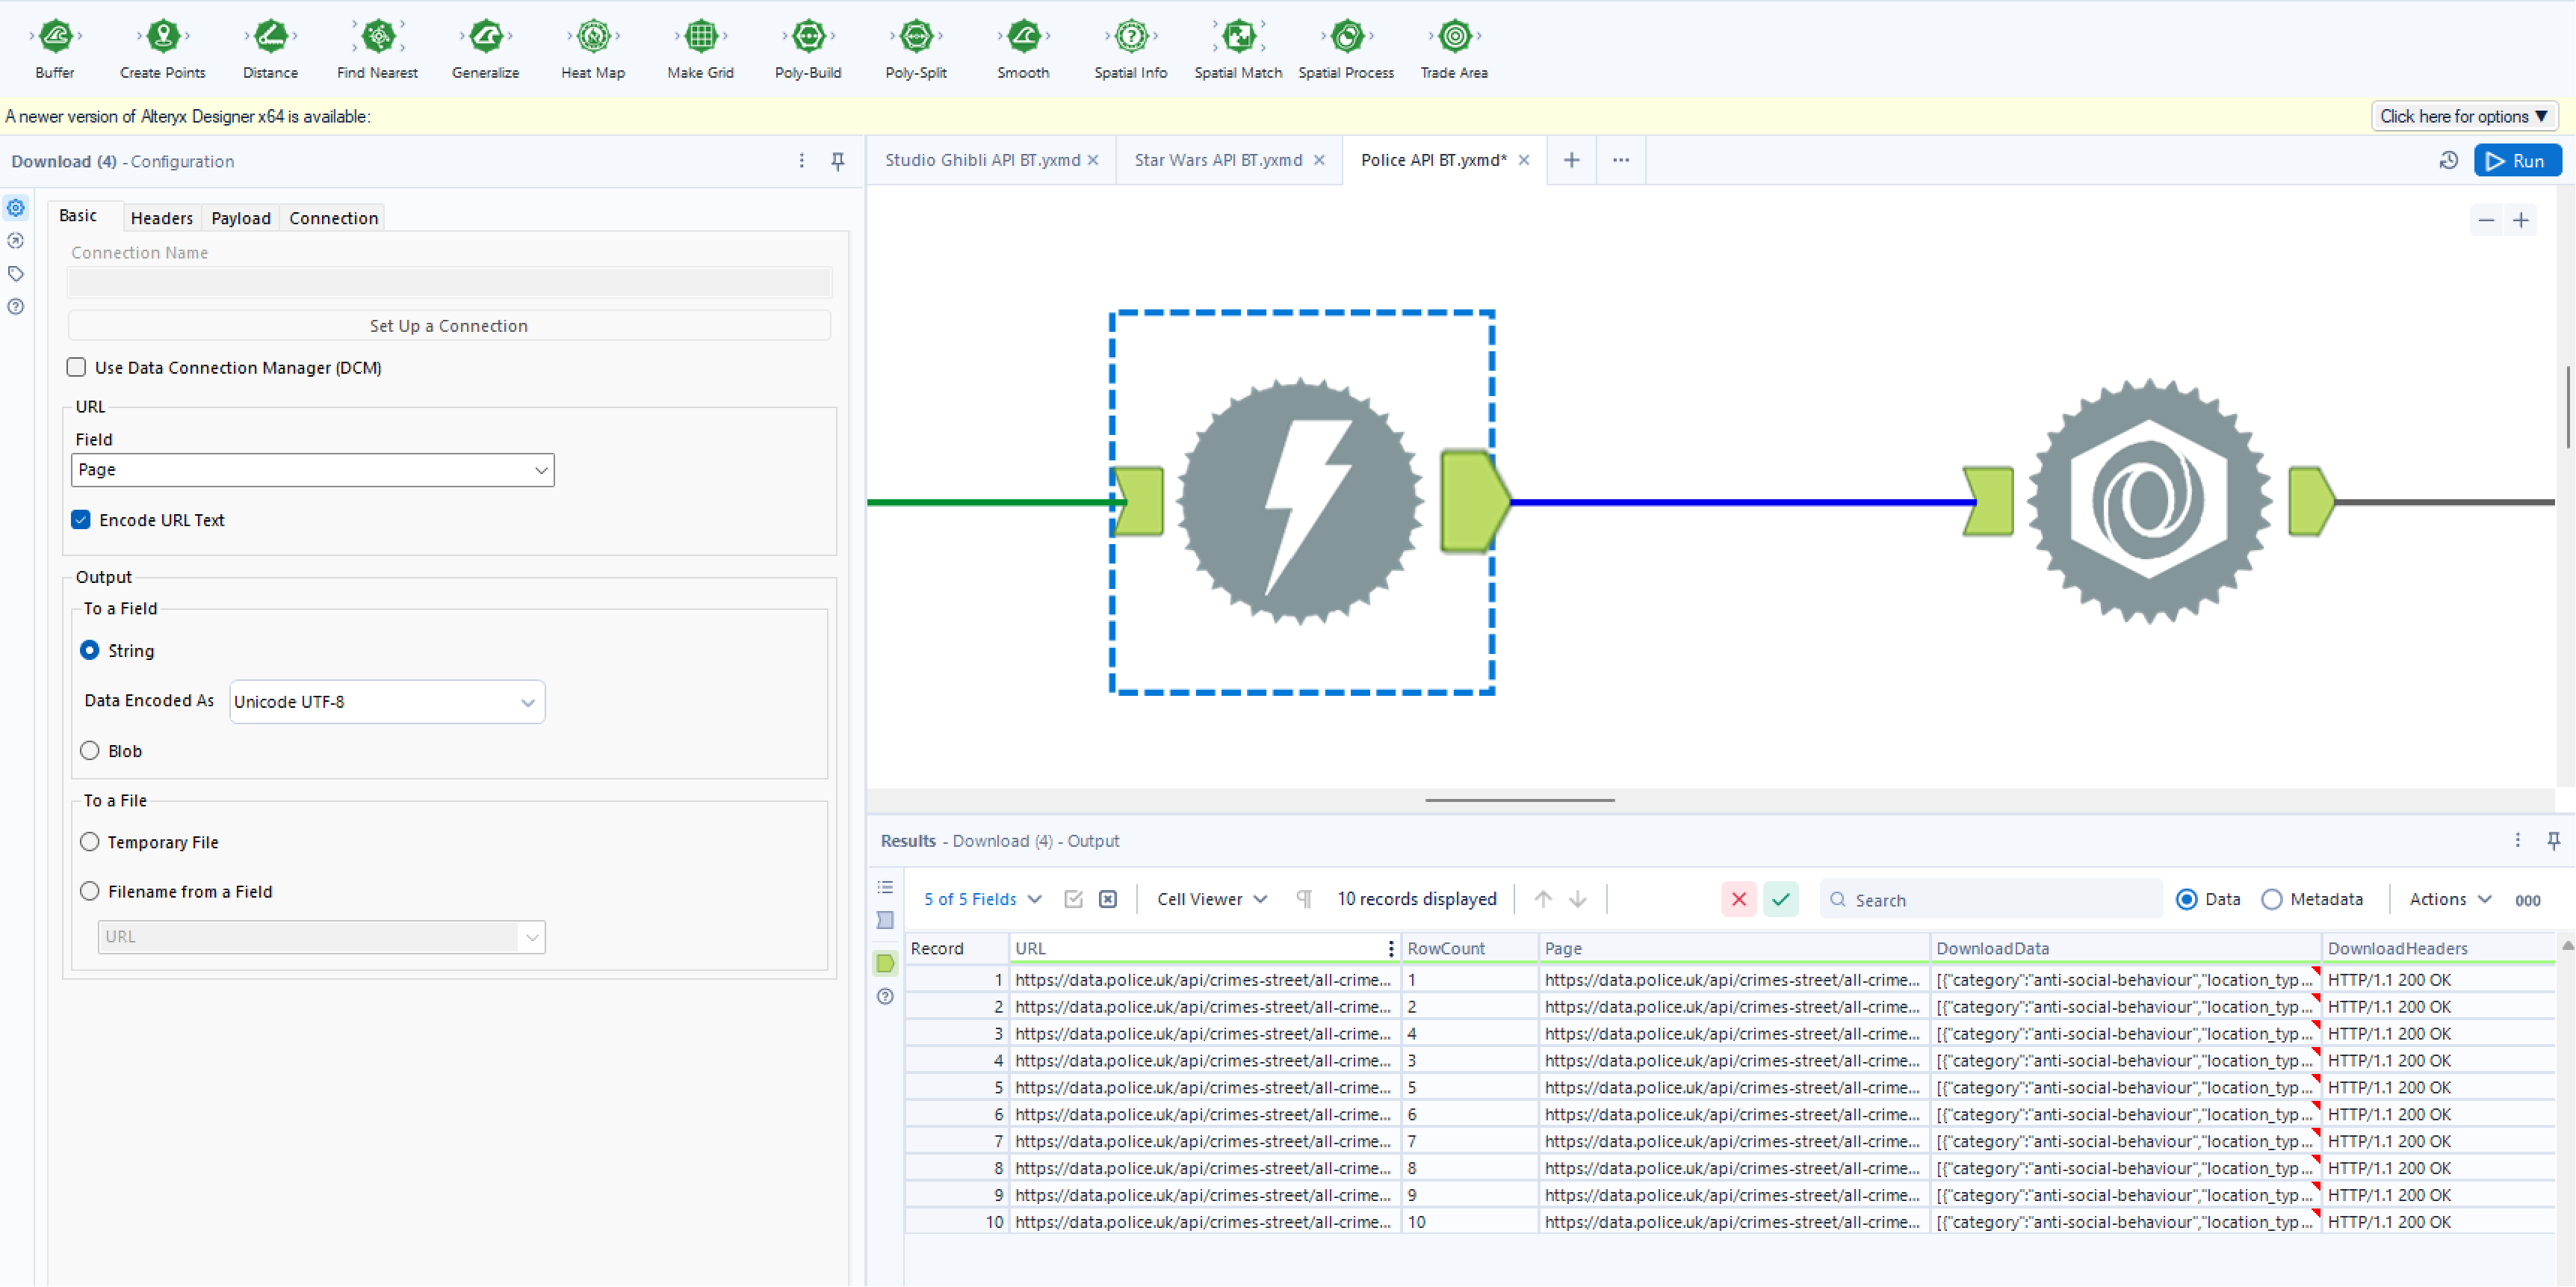
Step 4: Download tool is then used to connect to the Page URL and download the Raw data (DownloadedData Field)
Make sure the 'Use Data connection Manager (DCM)' is unticked and in this case we want to output our data into a String, so select the 'String' box too.
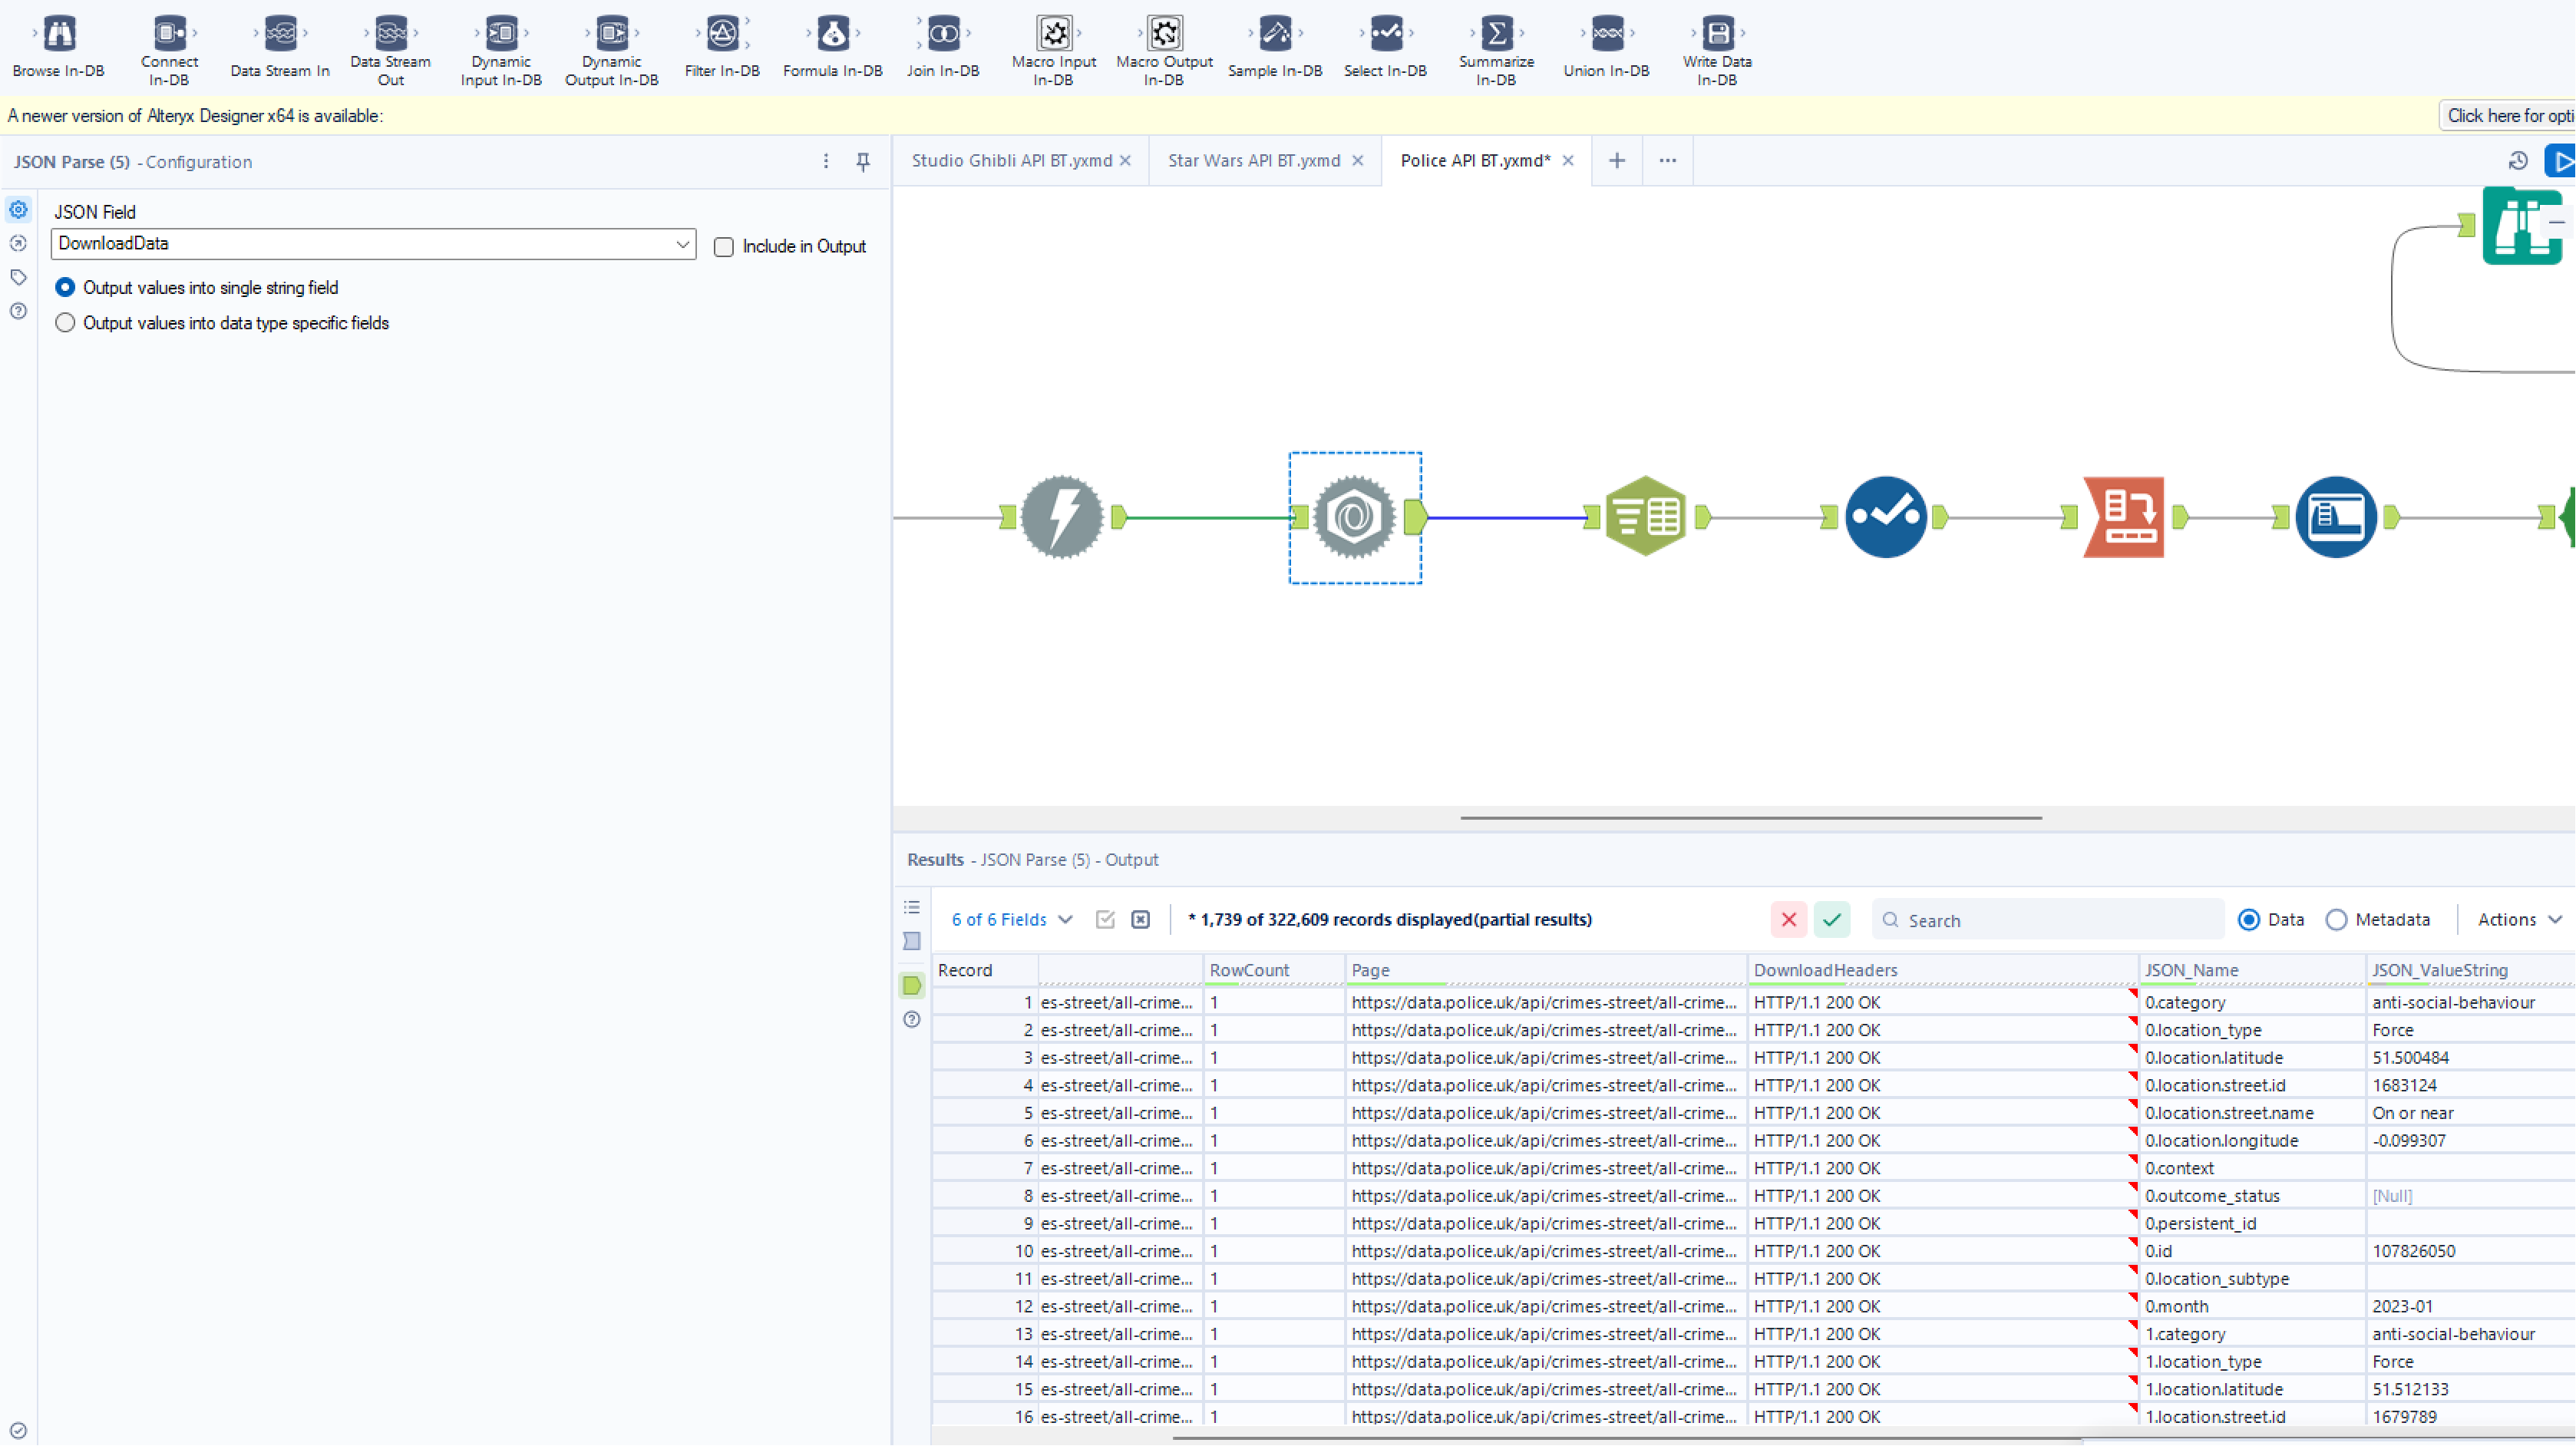
Step 5: JSON Parse tool then needs to be pointed to the JSON field which needs to be parsed, in this case it is our raw data in the DownloadData field. Once this is changed and run, you will have the additional fields : JSON_Name and JSON_ValueString.
JSON_Name will show a list of what all the headers will be in our final table once the data is reshaped, e.g longitude, street name, latitude. This then repeats in this case every 12 rows as every 12 rows shows information about 1 reported crime and its location
Whilst JSON_ValueString will will have the values to those correlated headers.
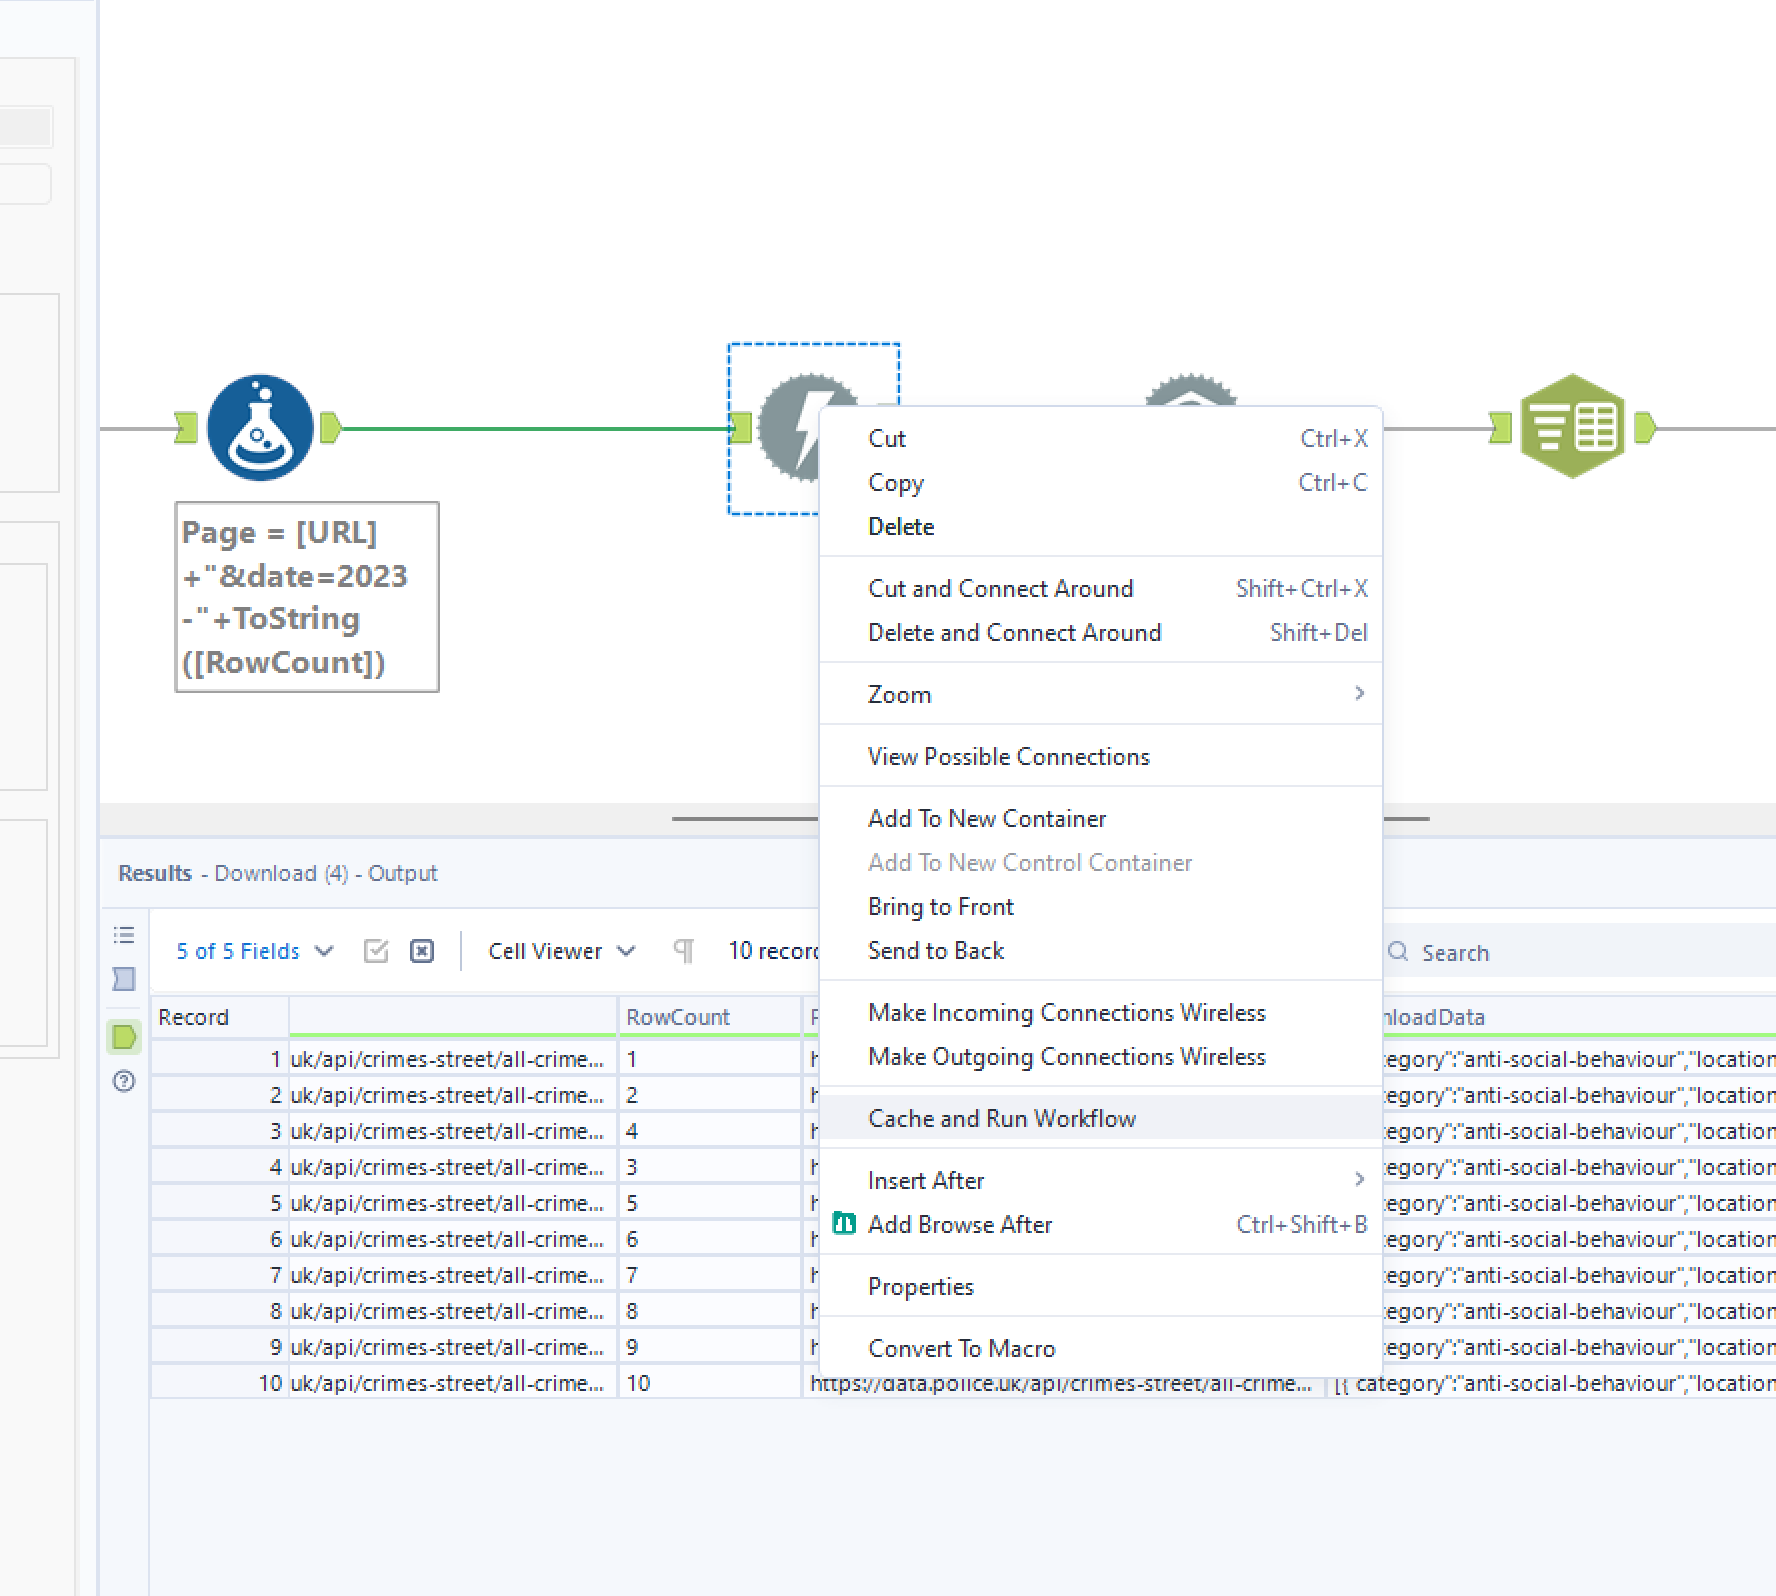
from here on, when you are running your workflow, ensure that you 'Cache' then run the workflow. This can be done by right clicking on the 'Download' Tool and selecting 'Cache and Run Workflow' (Shown below).
Caching and running workflows when using an API in Alteryx is essential for performance optimisation and cost reduction as caching involves storing API call results locally, reducing redundant calls and improving workflow speed. This can also lead to cost savings, particularly in scenarios where API usage is metered. therefore minimising the risk of temporary restrictions on further API requests.
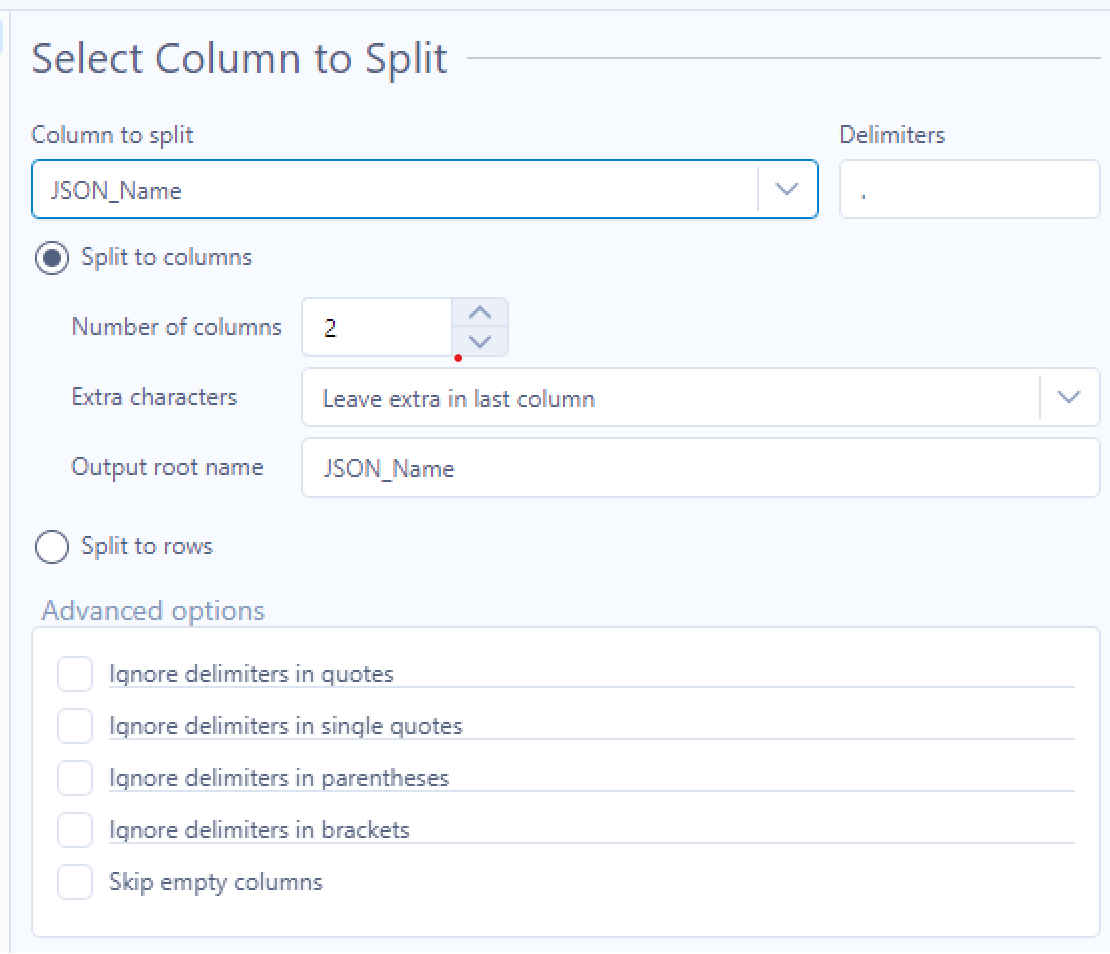
Step 6: Column to Split tool is next to separate the Crime ID number from what will become the Field Titles or Headers.
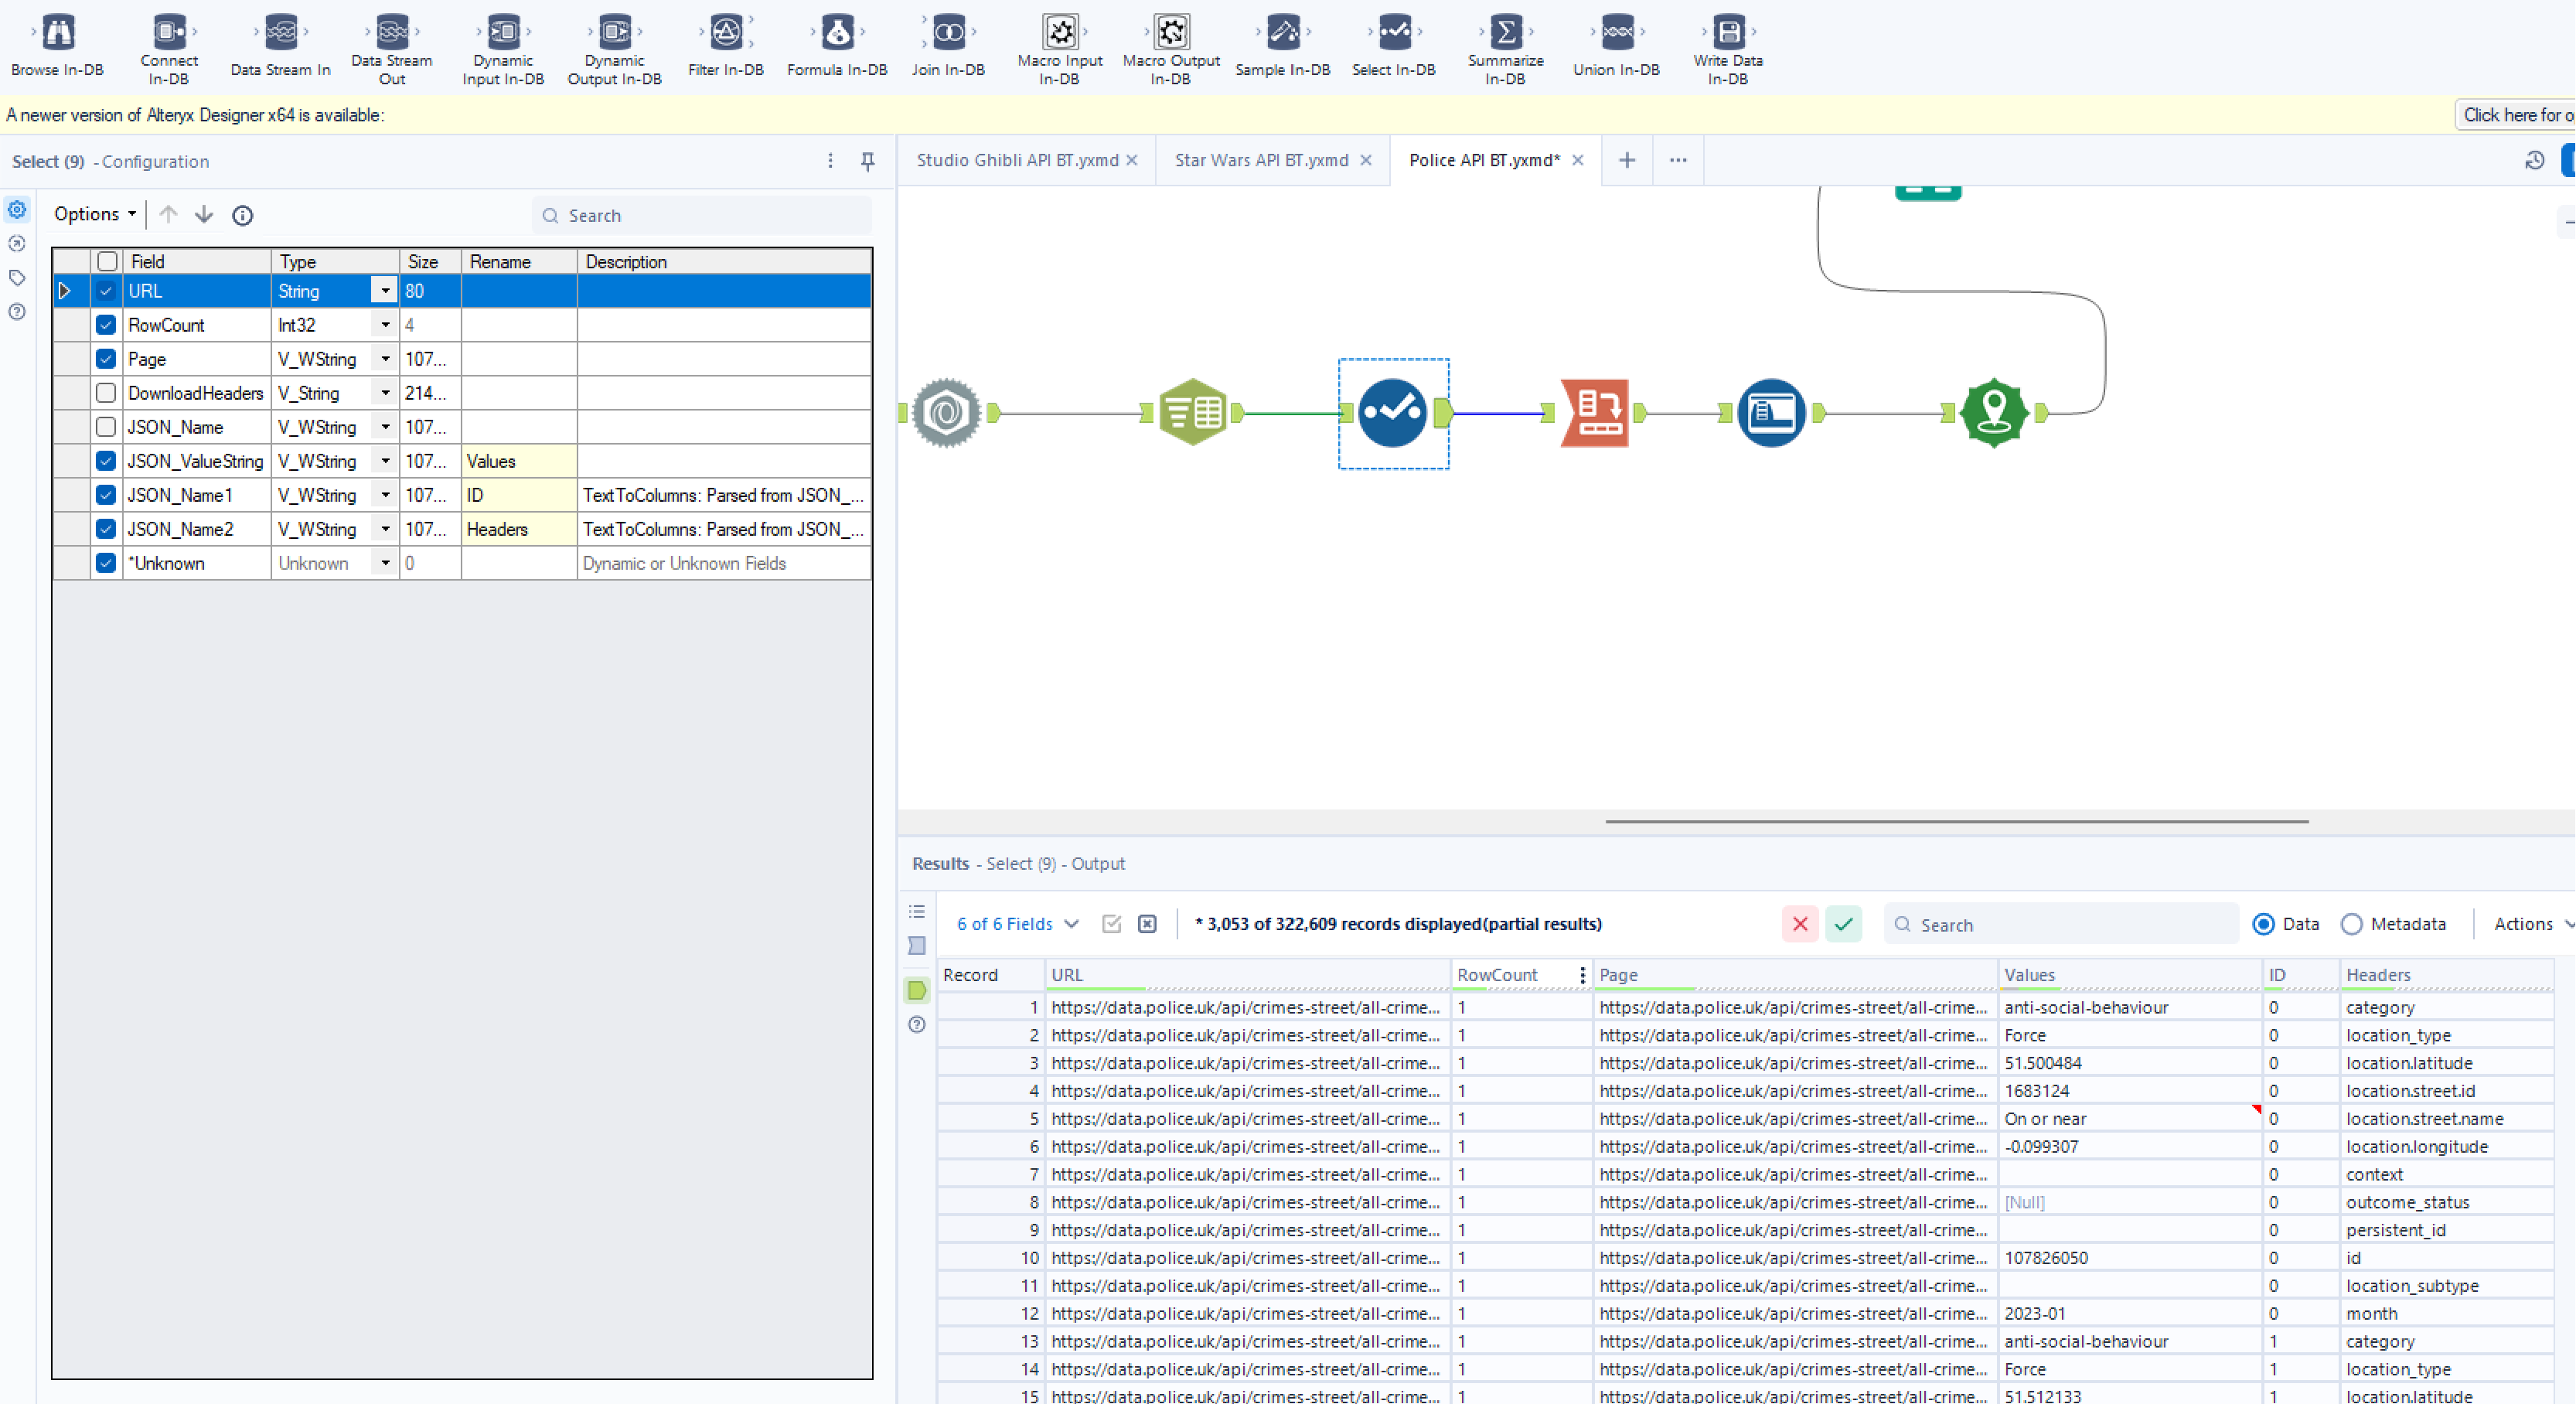
Step 7: Select Tool is then used to keep the relevant fields and rename our JSON fields to easier Headers. - Remember to keep using 'Cache and Run Workflow'!
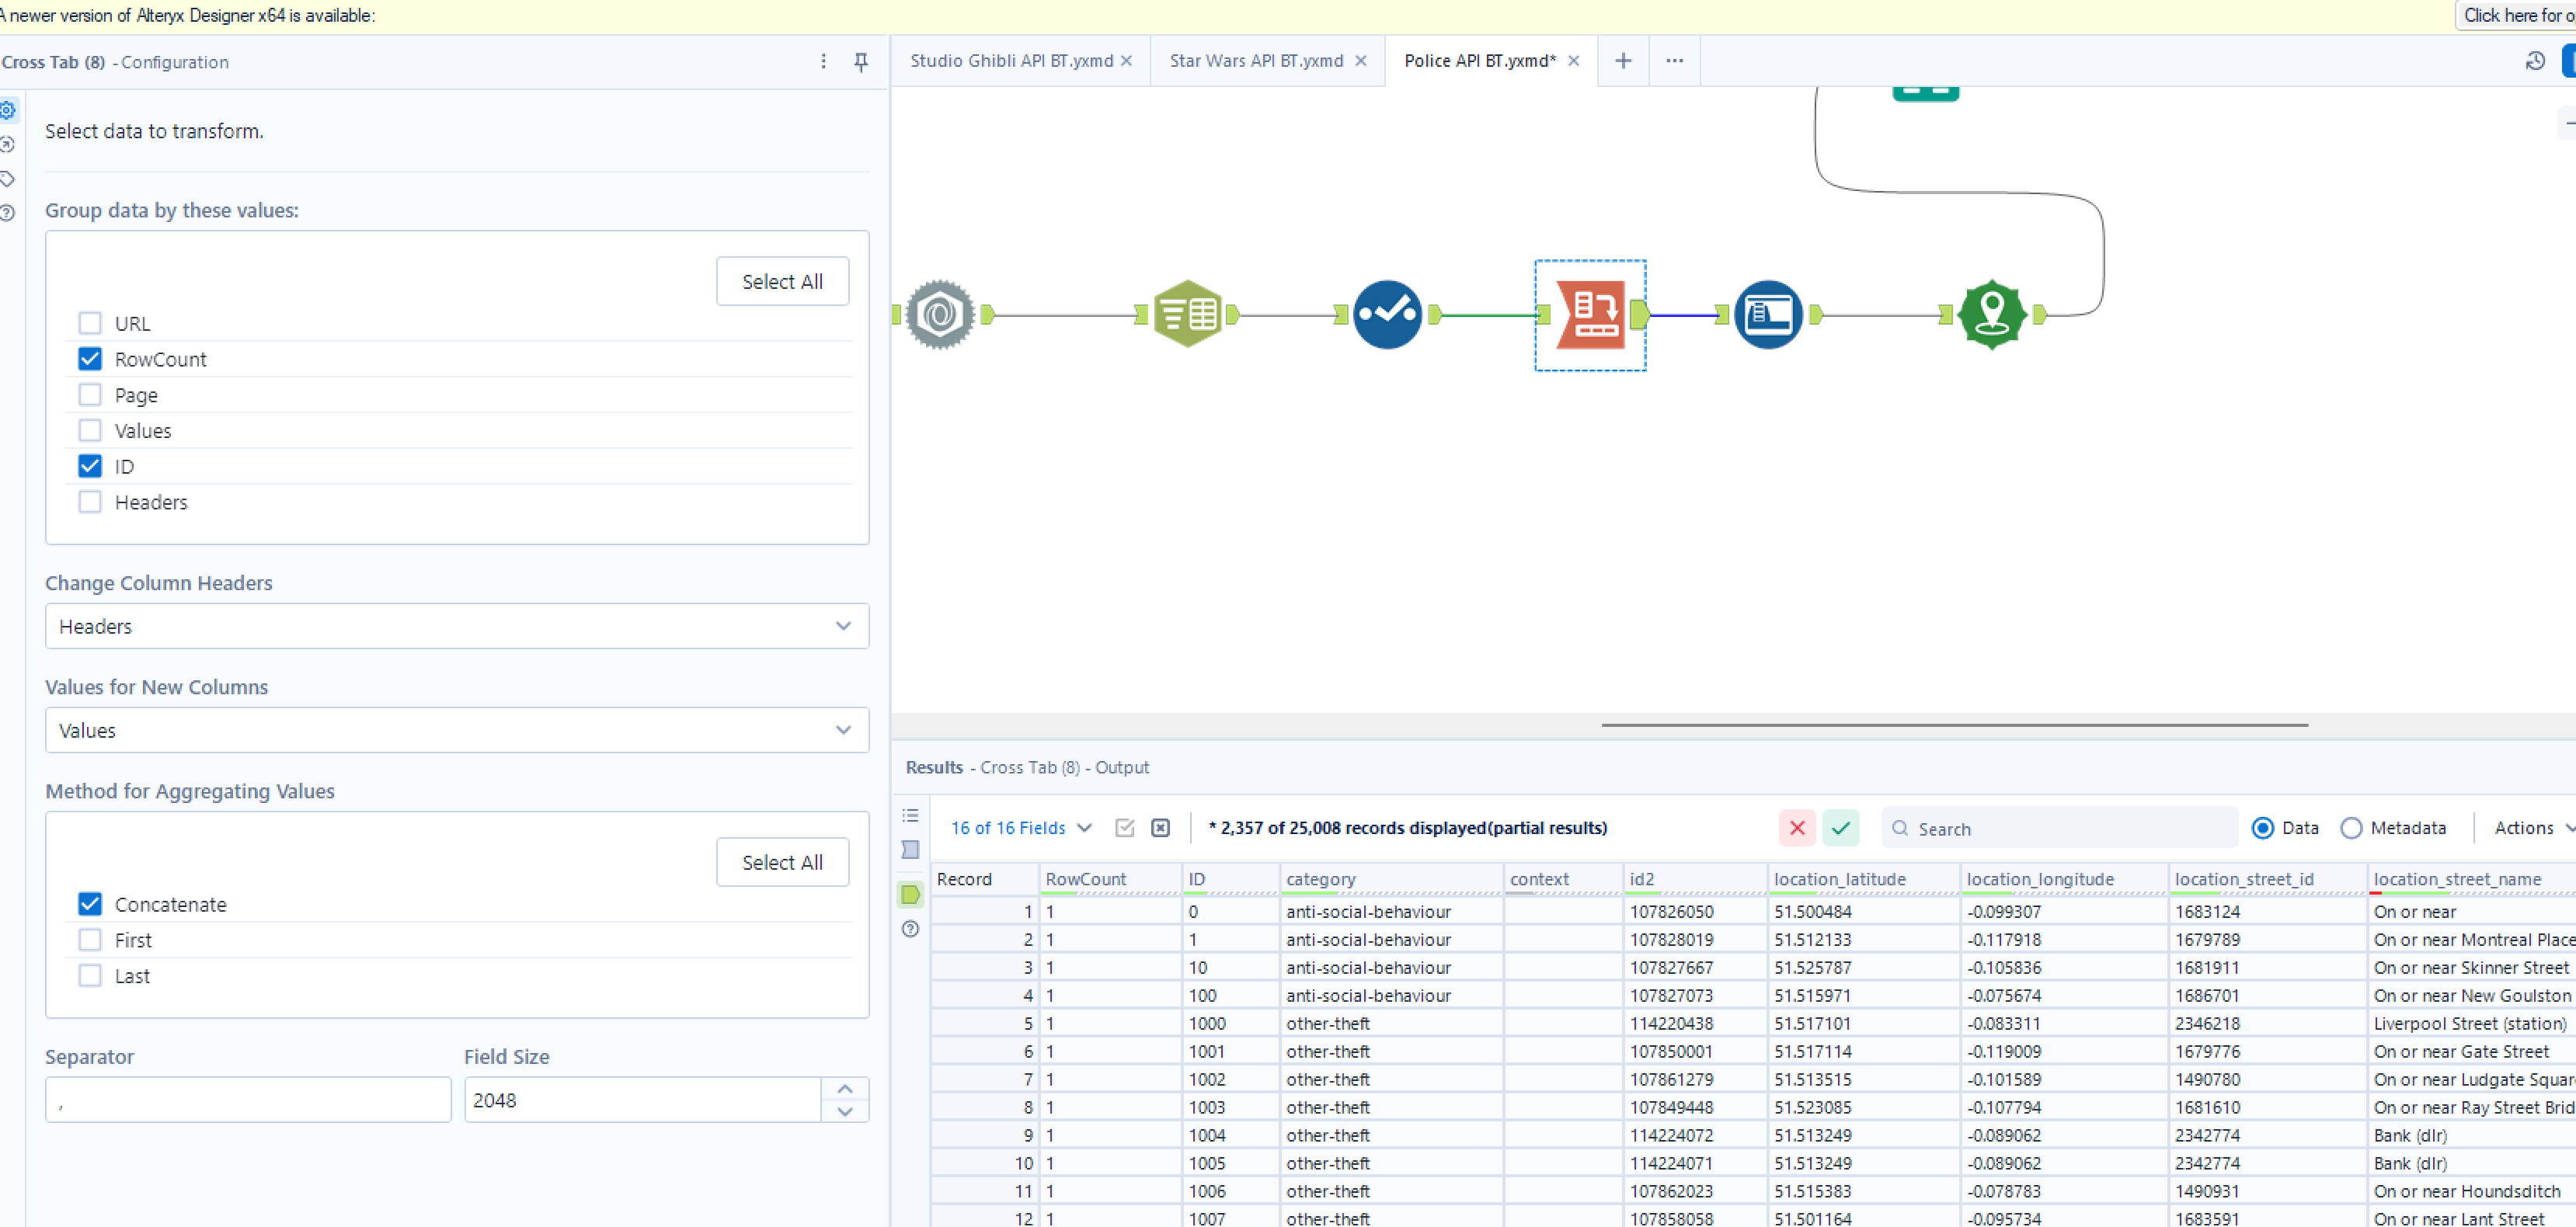
Step 8: CrossTab tool can then be used to help us to reshape the data so that each row can represent one crime that has been reported. In this case we want our Headers column to become our Field Titles with our 'Values' Below them. They are then grouped by their ID and RowCount.
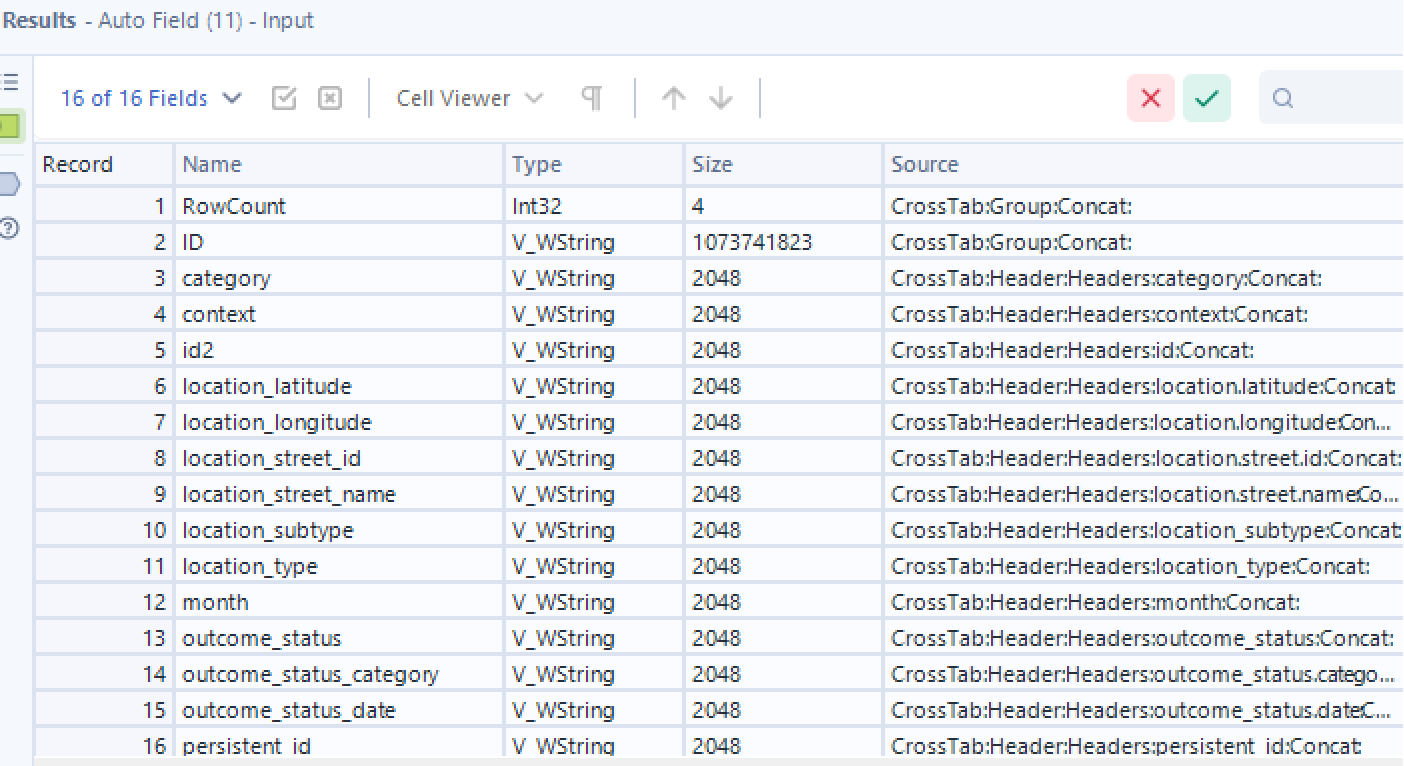
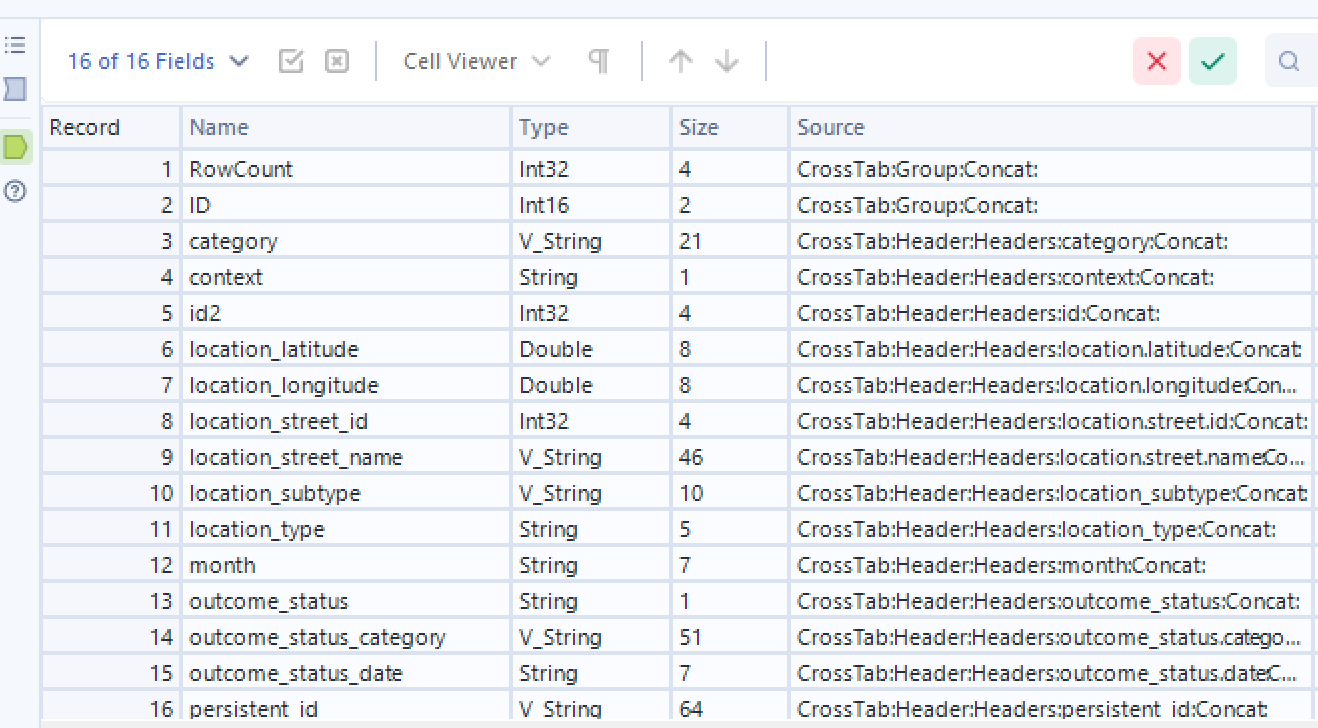
Step 9: Auto Field tool is used to automatically determine the data type and size for each of those fields, this is done to prepare our Longitude and Latitude fields.
Once it is used we can see that our Data types will then change (using the metadata toggle)
Step 10: Create Points Tool is then used to convert our Longitude and Latitiude Fields into Spatial Data. So change the Fields for X and Y to represent the Long and Lat fields in the data like so:
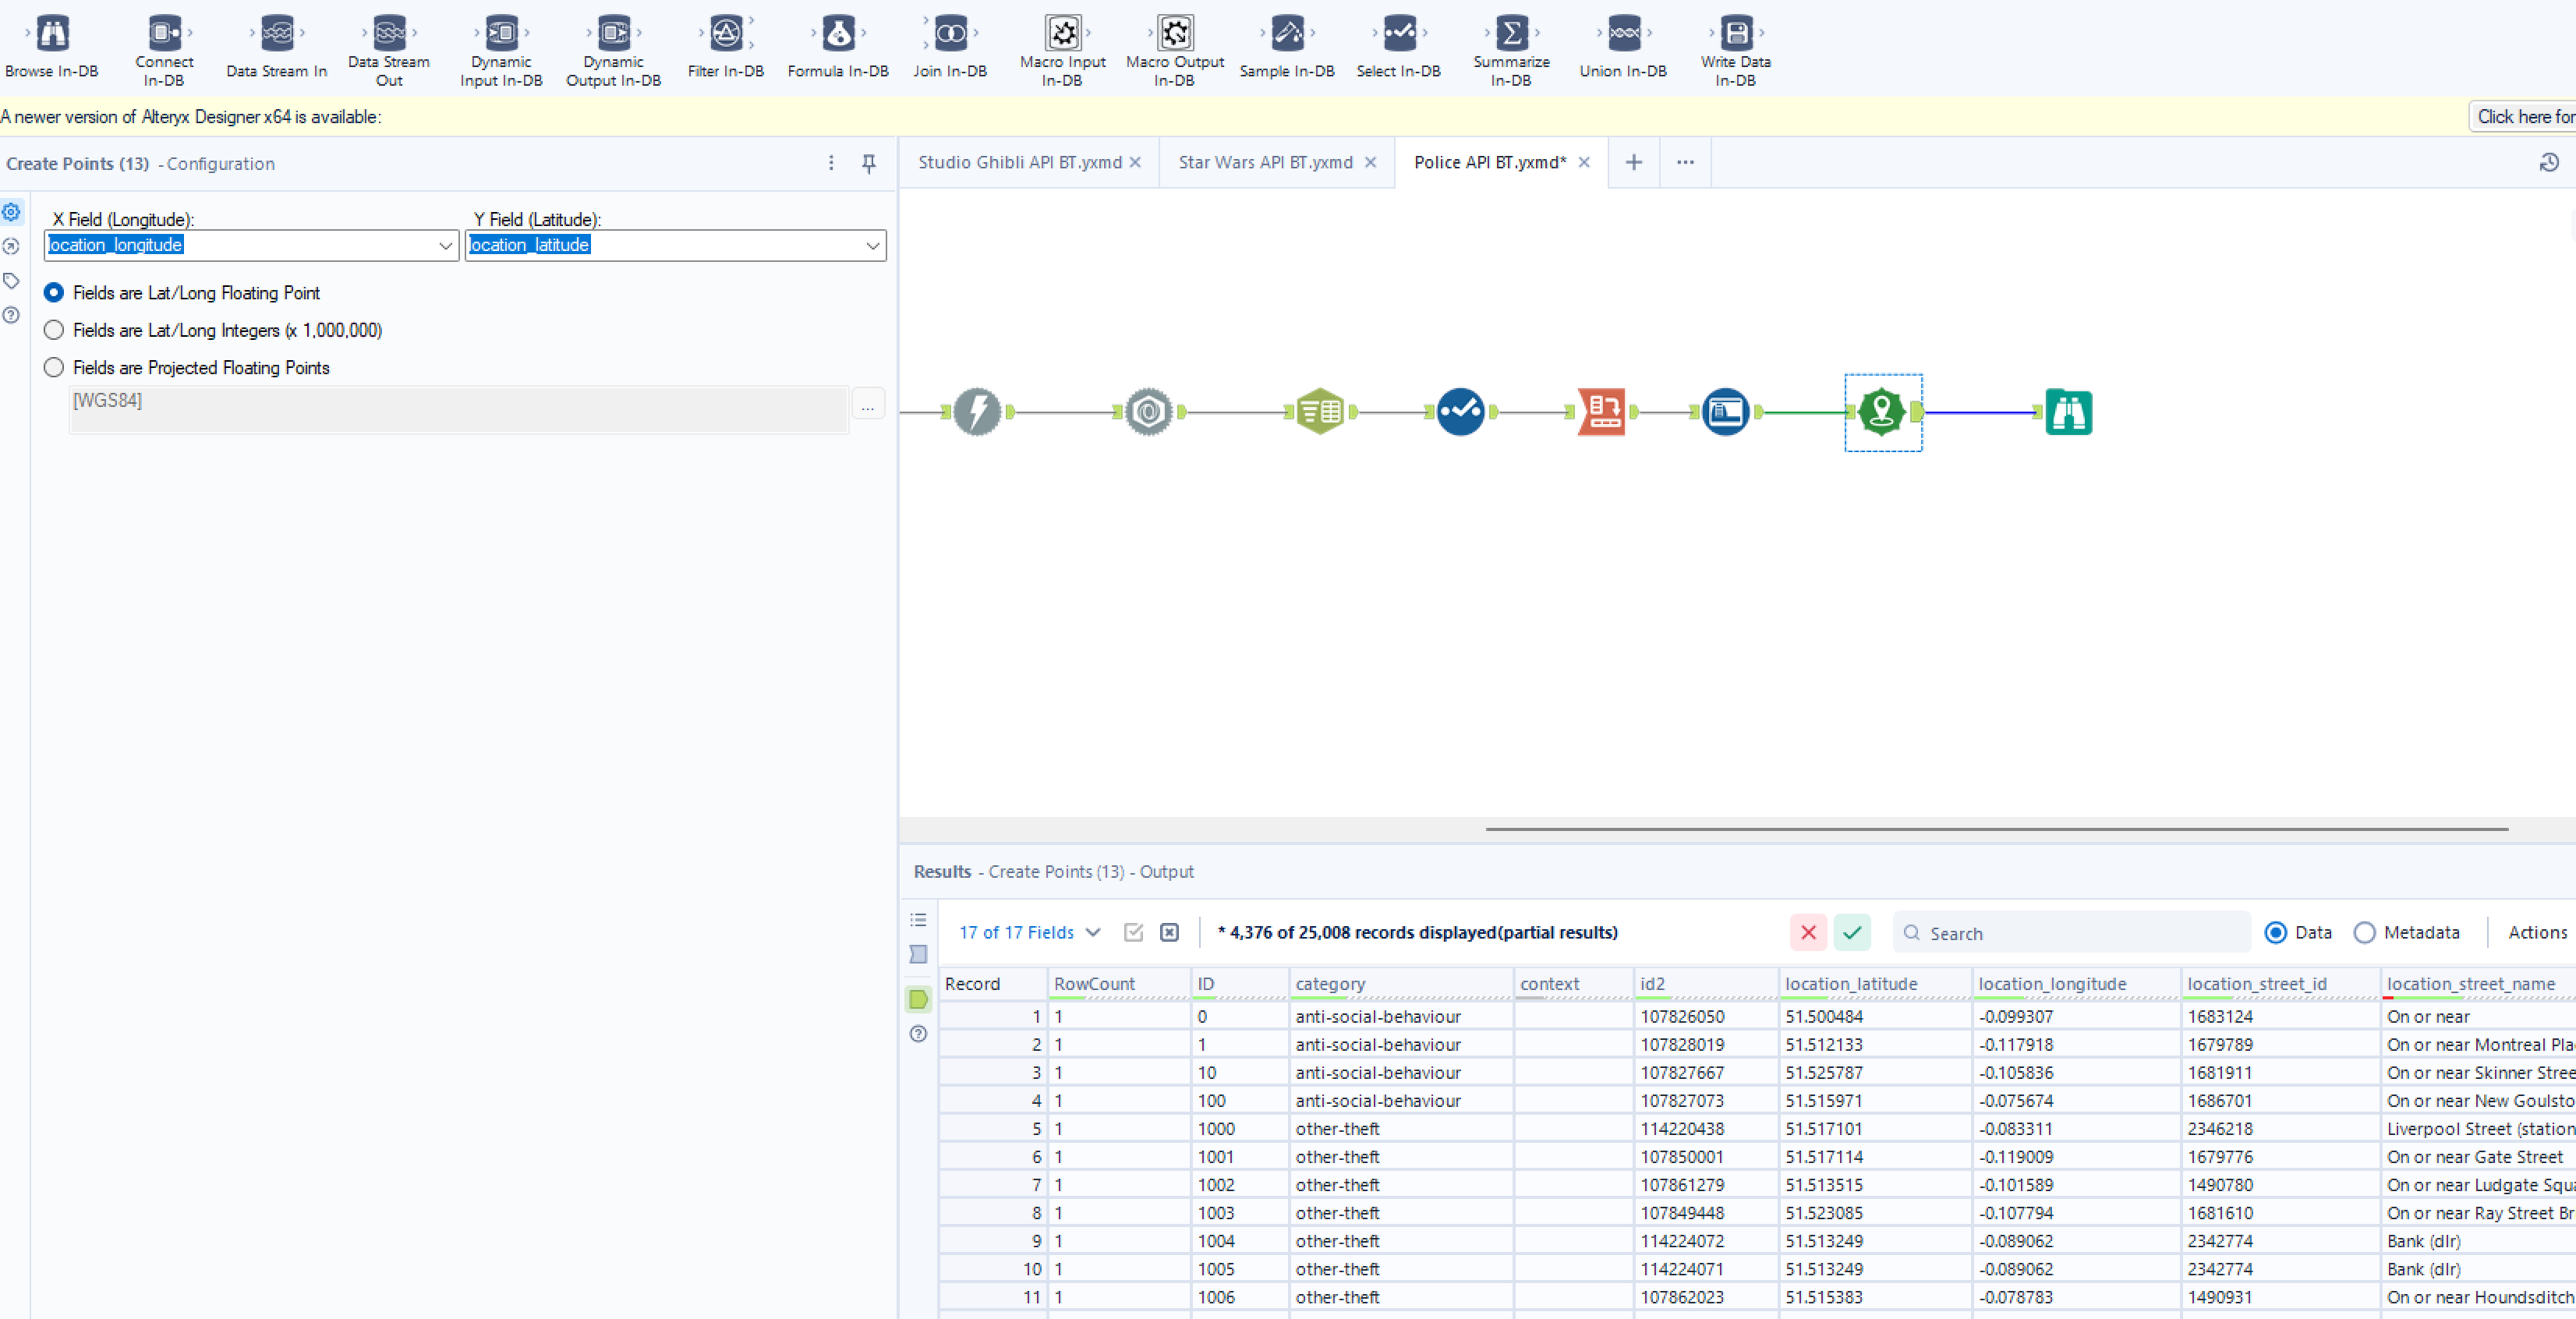
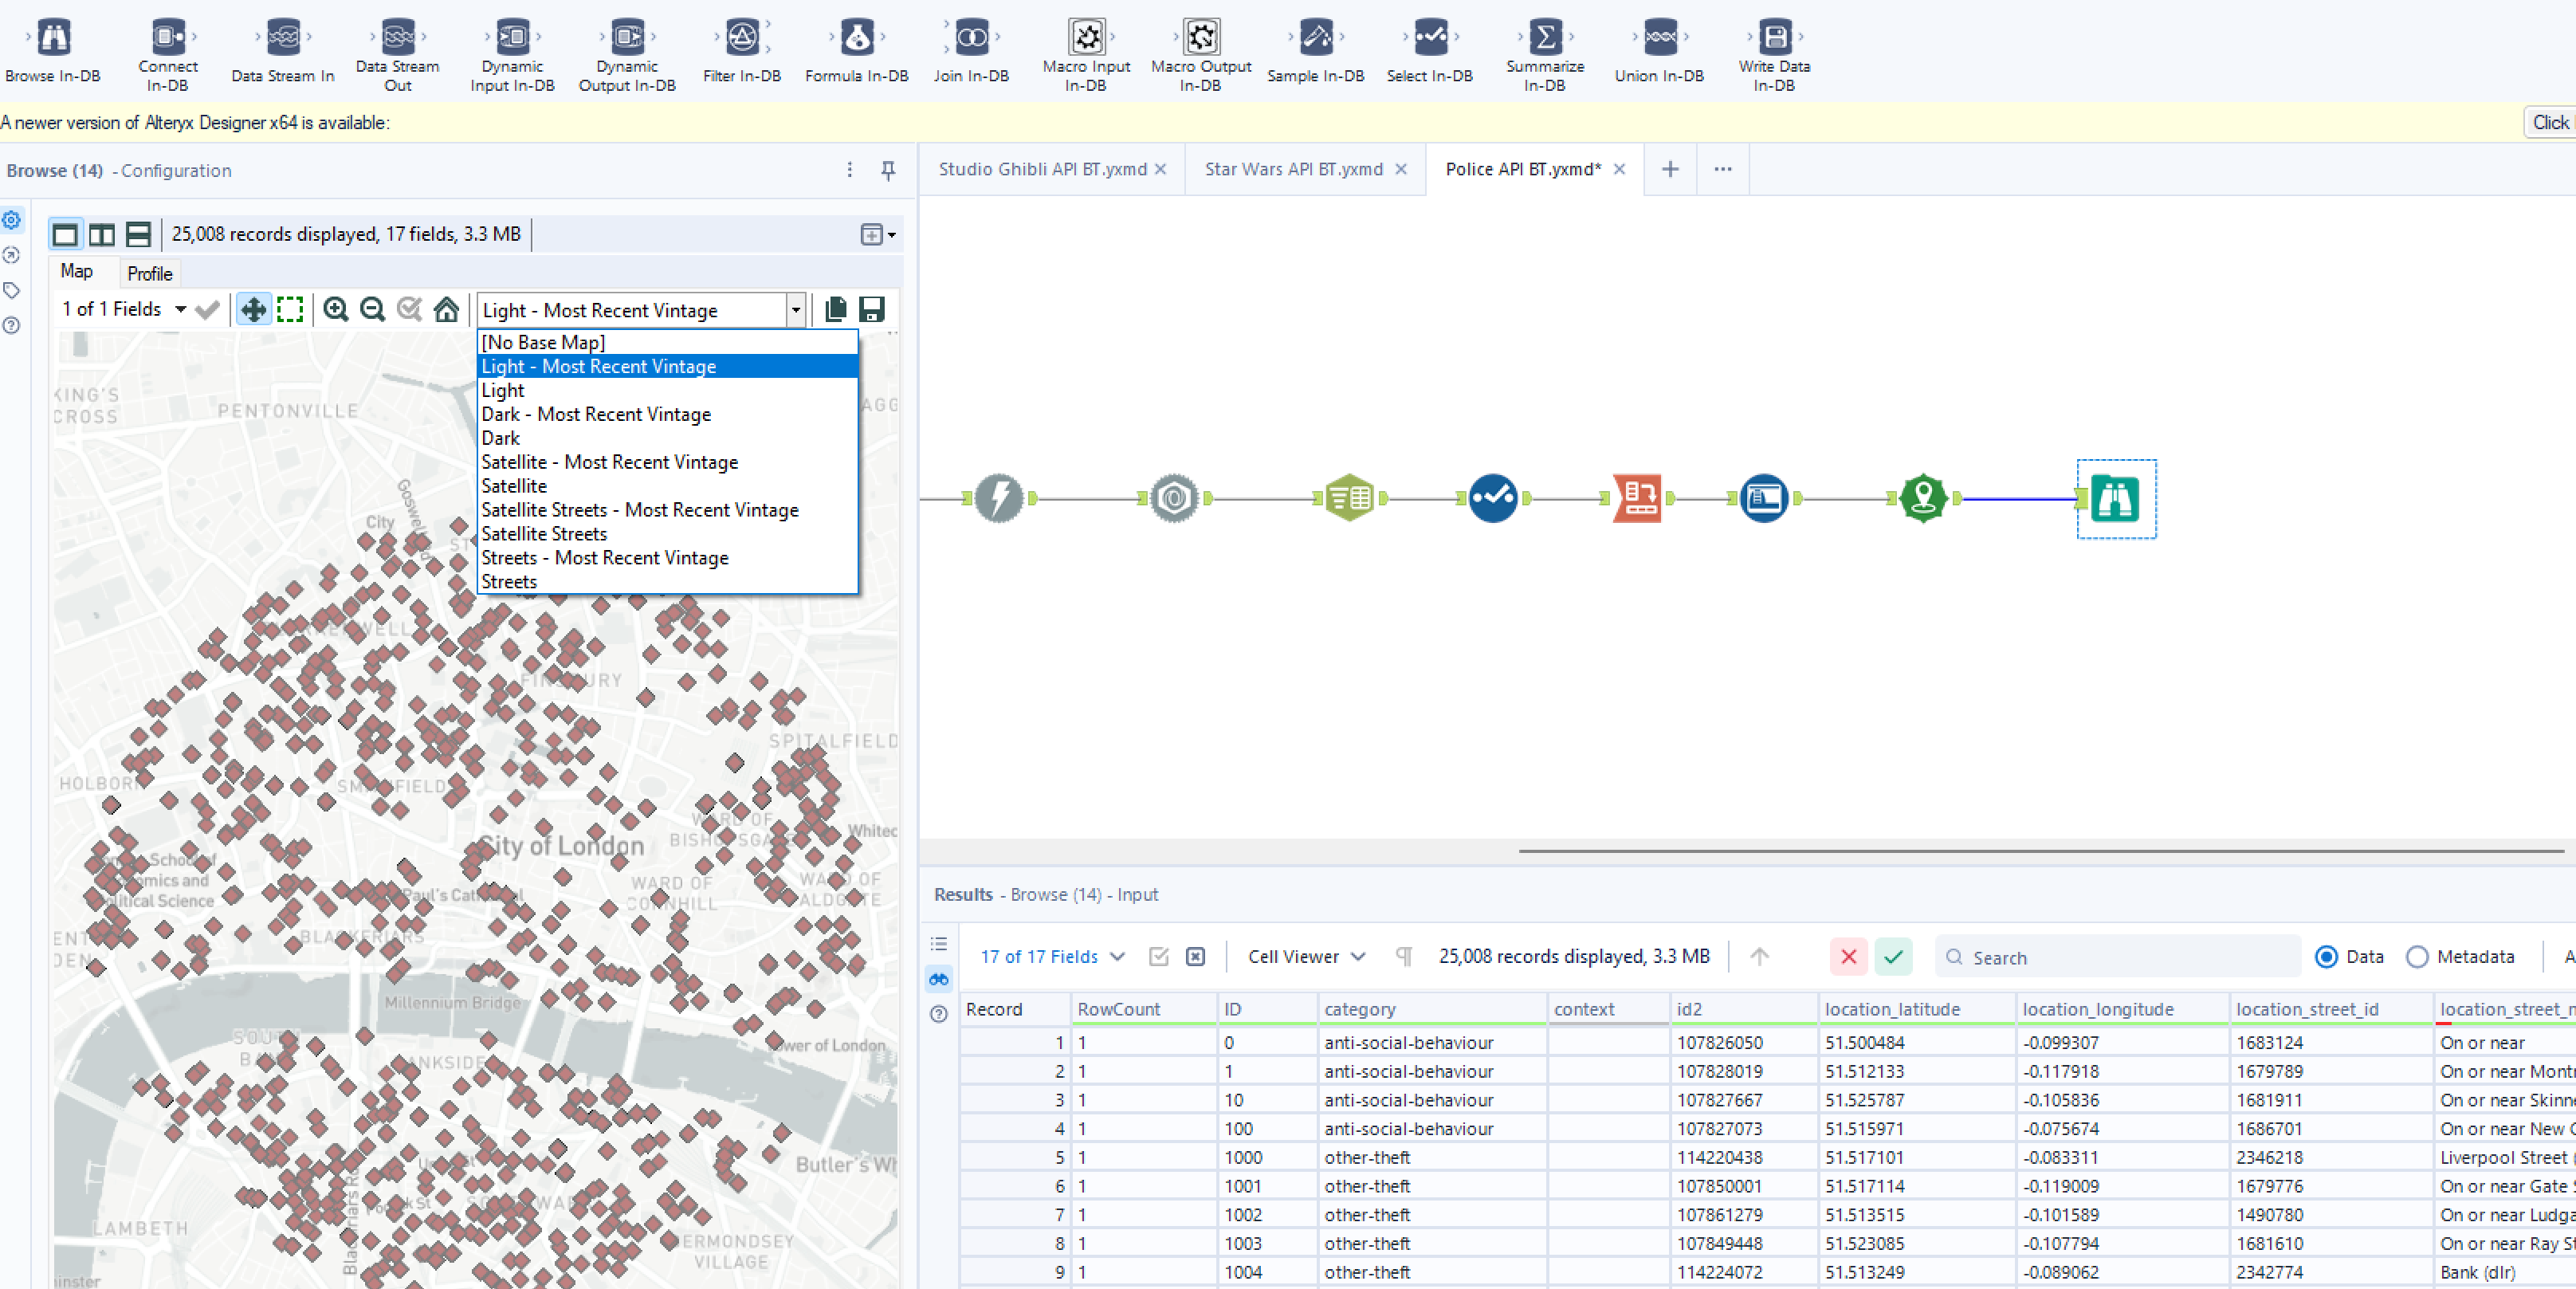
Inserting a Browse Tool at the end then lets you view you spatial data and table of reported crimes from 2023.
Selecting on the drop down shown in the image below shows you some options for the base of the map. I selected 'Light- Most Recent Vintage' but have a play around to whichever suits you!