


After my first week at The Data School, I already feel like my understanding of data has grown! In week 1 of our four months of training, we learned about the basics of data preparation - from cleaning and reshaping data, to combining multiple data sources.
Basic terms:
‘Data Fields’ - Categorical or measurable values in a data set (columns)
‘Records’ - An individual transaction or instance captured in the data (rows)
‘Granularity’ - what each record is telling you ie the base level of information in the data
Rules of Data Structure:
When we start preparing data, we should always start by asking ‘What am I trying to understand?’
While there are different approaches depending on what the data will be used for, a good starting point is to see whether the data meets the following rules of data structure:
- One data field for each category and measure (everything sits in its own column)
- One data type for each data field (numeric, string, date or Boolean)
- A single date column where possible
- One row should be a record containing all values in each data field possible
Cleaning the Data:
If the data doesn’t meet these rules, we need a plan for getting it back to them. There are several ways to do this, and each person might have a different approach, but a good starting point is to clean the data. Below are some steps for doing this:
- Rename headers: name each data field in a clear, descriptive name
- Splitting columns: create data field with a single data type, and a category or measure
- Filtering: only retain accurate and necessary data (do this later)
- Remove spelling mistakes: create a set of values that are accurate and correct
- Forming the data fields you need from what you’ve got: using current data fields to form those that you need to for your analysis
Reshaping Data:
Once the data is in a nice clean format, we can think about reshaping it. Always refer to those initial rules - the goal here is for each row to be a record made up of all categories and measures. With this in mind, it can often be useful to reshape the data. There are a few ways to do this...
Pivoting: There are two types of pivoting data, depending on what will clean it in the best way for its end use.
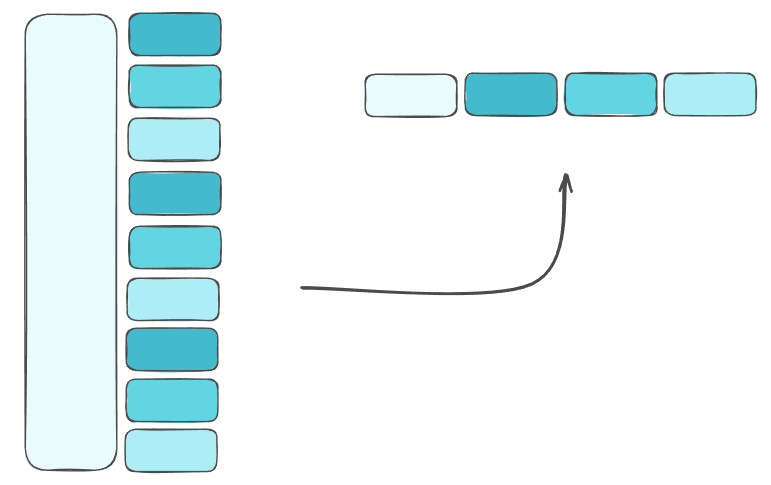
Columns to Rows (unpivot) – takes columns representing the same metric and converts to a single column of values (adds one additional column to hold previous headers)
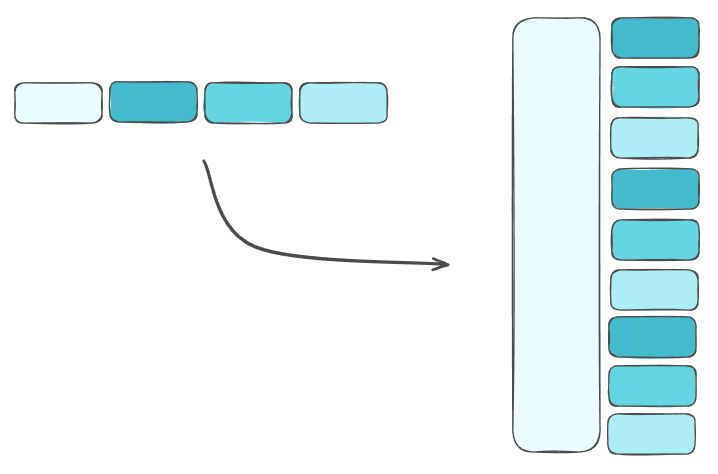
Rows to Columns (pivot) – multiple metrics in the same column (converts each metric to their own column)
Aggregation: This is useful if there are multiple rows for one data field (a) that you want to combine. While this will remove data fields, reducing the granularity of the dataset, it can be useful for giving an overall insight to data field (a).
Combining multiple data sources:
Sometimes it can be useful to combine multiple data sources. Most analytical tools expect to read from one input, so combining these can make the data more useful for analysis.
Unions: Stacking multiple data sets to add additional records. In order to do this, you need to make sure that both data sets have the same data fields (checking that headers match up first).
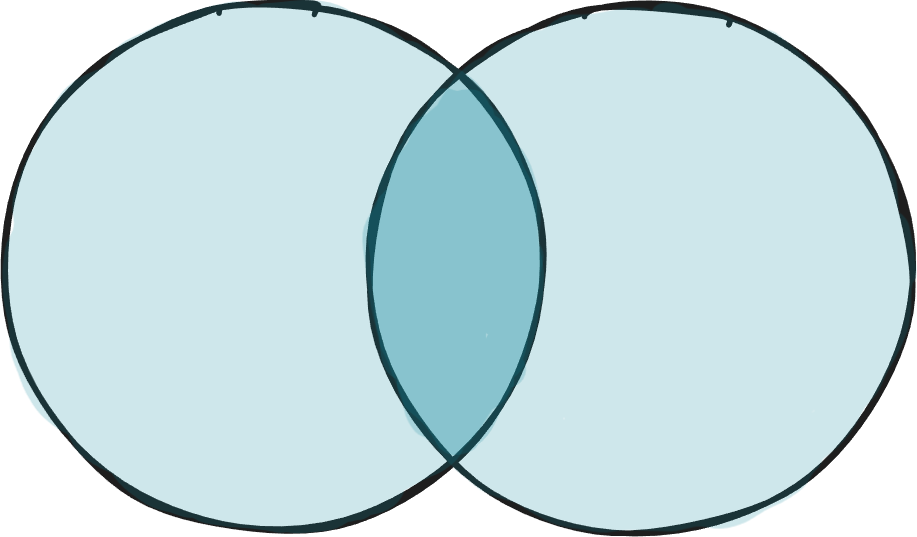
Joins: Adding data fields (categorical or measures) to add multiple data sources. To create a Join, you need a Join Condition/Clause and a Join Type. When doing this, we need to be cautious of different granularities, as this could lead to an explosion of rows.
The Join Condition is the logic of how two of your data sets will fit together, detailing where values will match or not. Most tools allow for different operators (eg =, >, !=, >=).
There are four Join Types to choose from...
Inner Joins: keeps only records that matched in both tables.

Left (outer) Joins: keep only records that matched and any unmatched from the left table.

Right (outer) Joins: keep only records that matched and any unmatched from the right table.

Full (outer) Joins: keep all records from both tables (avoid these!).
These are the basics of Data Preparation that I learned in Week 1 of The Data School. Once we got our heads around these, we practiced applying these changes in Tableau Prep using the Preppin’ Data challenges. If you want to try them yourself, you can find them here.