In this article I'm going to show you how LOD expressions basically work whereby we'll focus on the so called FIXED-Expression. But before we dive into LOD expressions, I want to show you how aggregations essentially work in Tableau. In according to do that I'm going to start Tableau and load the well known superstore data set as shown below.
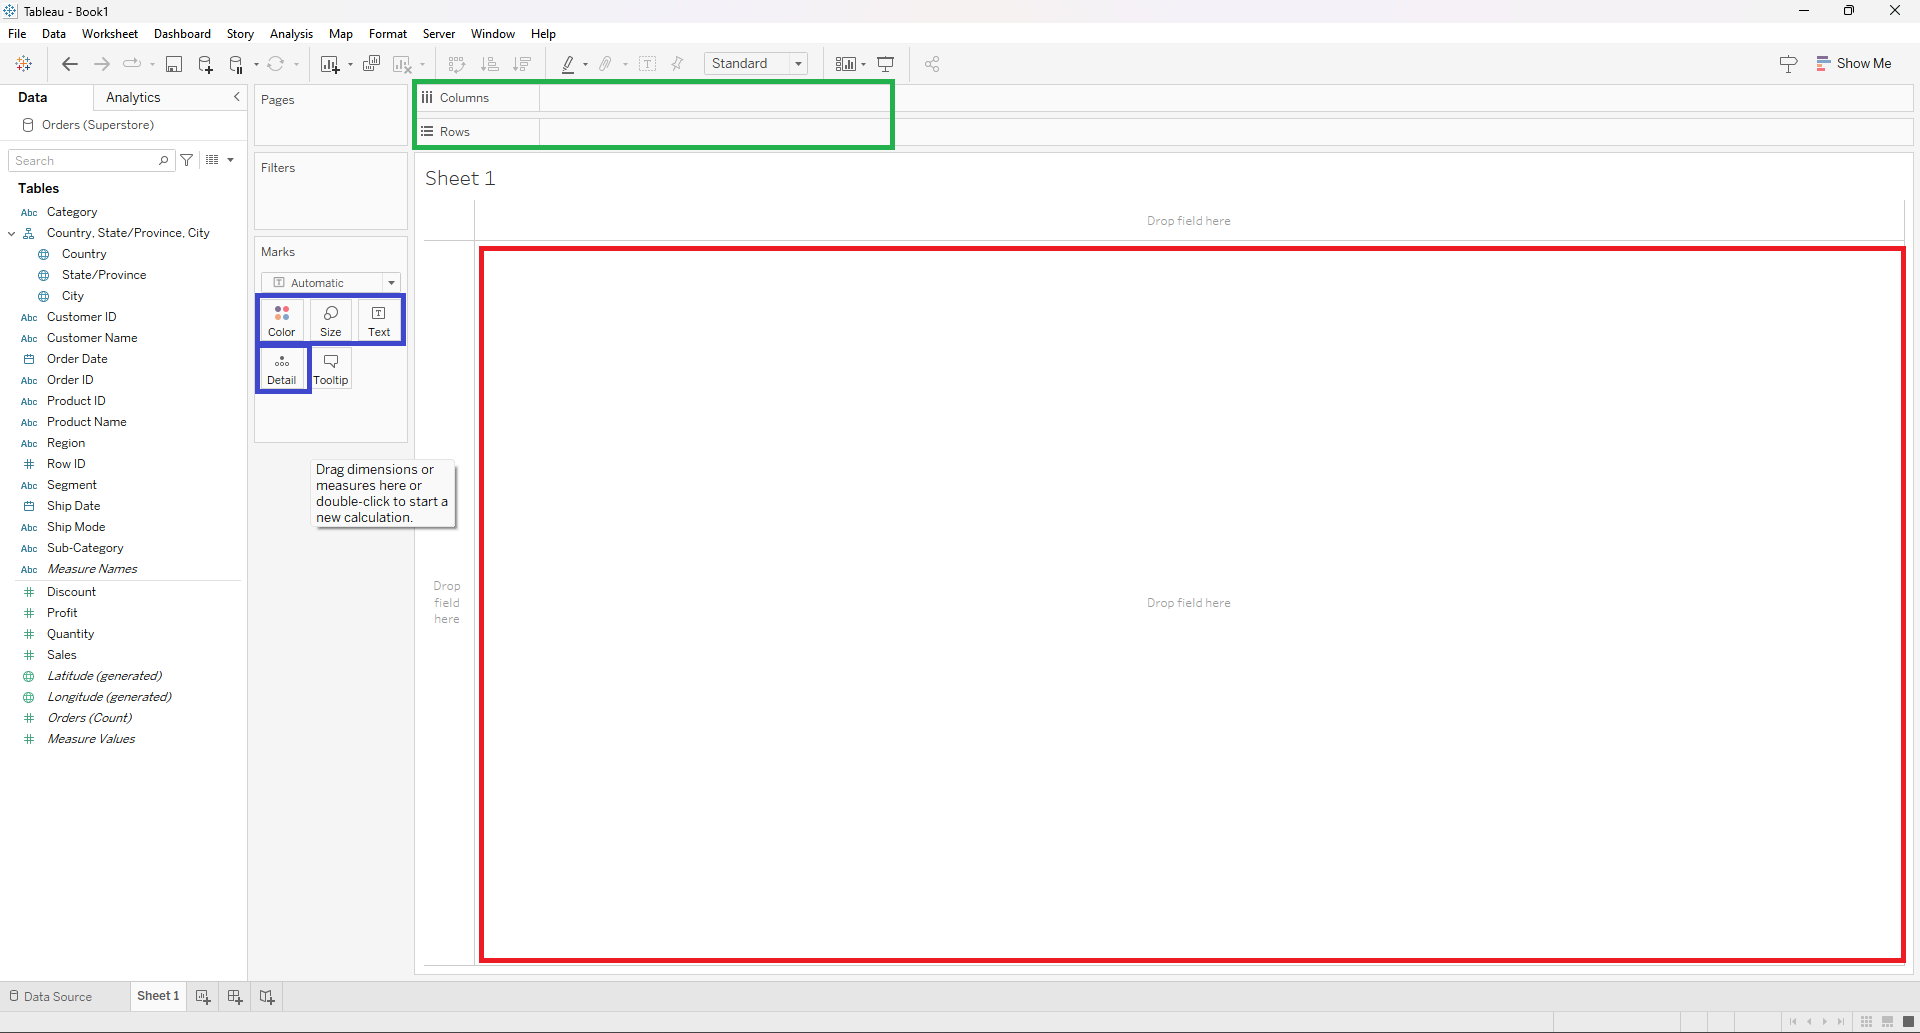
When we work with visualisations in Tableau we basically work on the view level of detail and there are three areas. In the red area appears the visualisation we want to create, that can be, for example, a chart, a map or a simple text table. To create a visualisation we can put any dimension or measure into the Columns or Rows shelf (green area), depends on how and what kind of chart we want to see but any additional measure or dimension changes the view level of detail the same applies to marks card (blue area) whereas the tooltip never change the view level of detail.
To make this clear I'm going to show you a simple example. Let's assume we want to see the sum of sales for each region:

We now see the sum of sales per region but let's put the segment on the color mark as well to see what happens:

Now the view level of detail is a bit finer due to the segment dimension on the color mark. In according to show you when LOD expressions come into play, I'm creating a new sheet to see the sum of sales per segment for each region like in the picture below:
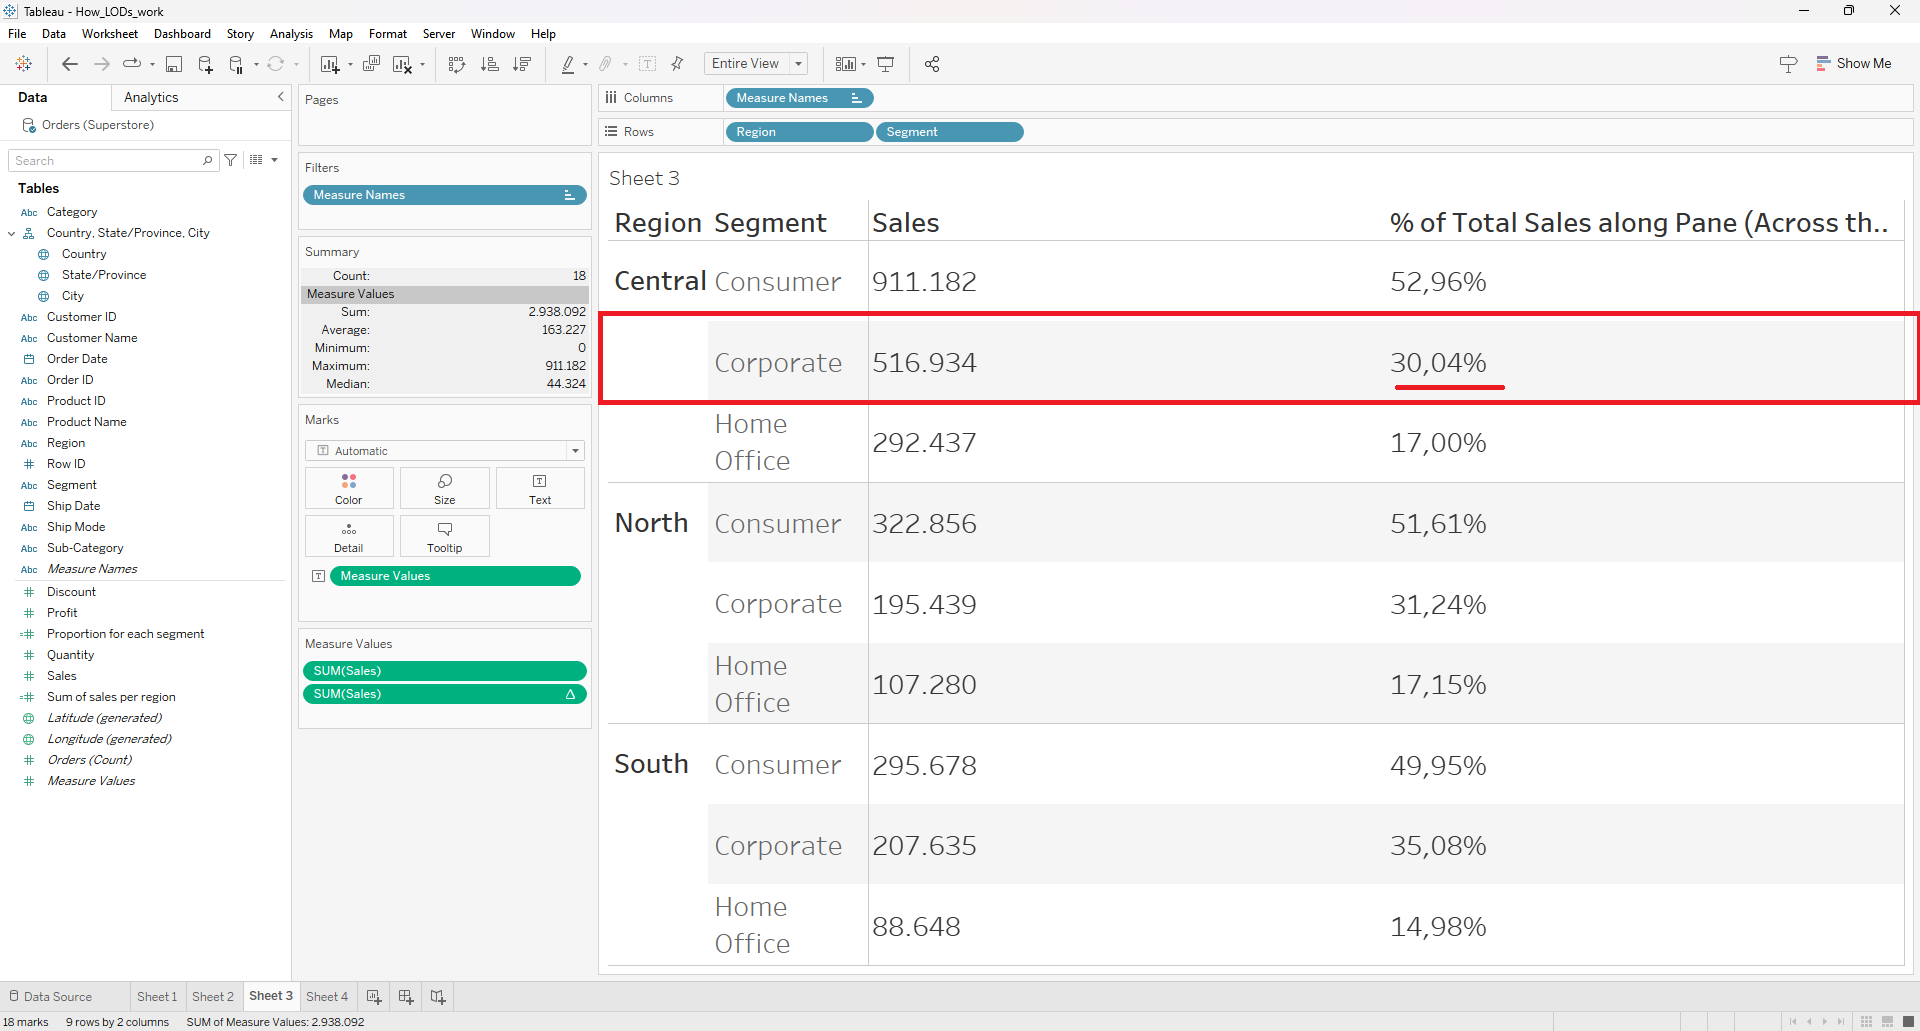
As shown in the table above it shows us the sum of sales for each segment and region but also the proportion (in %) of each segment. The calculation of the proportions based on table calculations. To get more information about table calculations click here. Assume we only want to see the proportion for the segment "Corporate" of the central region, which is currently 30.04 %. Keep this number as reference because I'm going to drag the segment into the filter shelf to filter everything out, except "Corporate". Let's see what will happen:

Now the proportion of "Corporate" is 100%! But that can't be as we just have seen. What happend there? To understand that behaviour, we need to know how Tableau works internally. Let's take a look into the next picture:
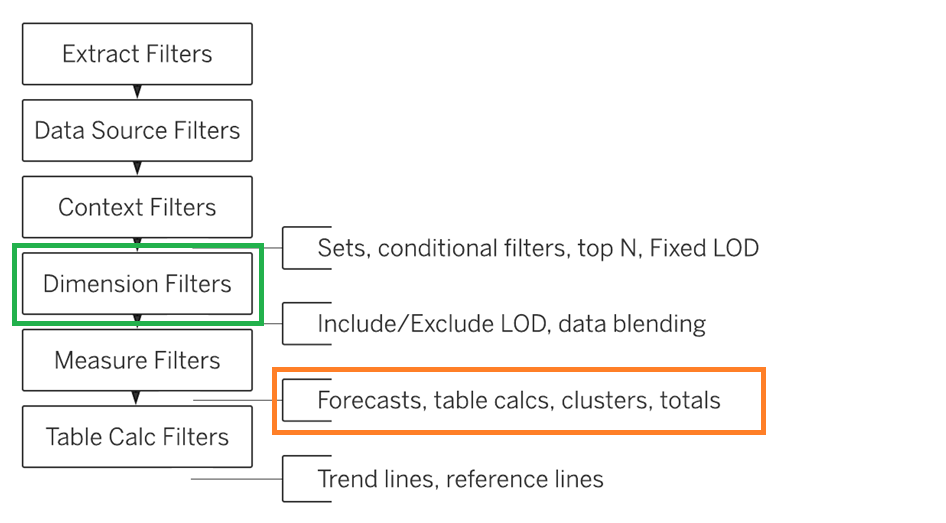
As mentioned before, we used table calculations to get the proportion for each segment but after filtering only by "Corporate" we got a different result because, as shown in the picture above, dimensions filters (green) are executed before the table calculations (orange) but as you might see, LOD calculations are executed before the dimension filters. So now the time has come to use a LOD function to avoid the issue we faced in our example before. Let's create a LOD calculation:

A LOD expression always starts and ends with a curly brace ({}). After the first brace you specify the kind of LOD (green). There are three different: FIXED, EXCLUDE and INCLUDE but as mentioned at the very beginning, we're just focusing on the FIXED expression. The specification is followed by any dimensions (blue). After the dimensions always follows by a double point and then the aggregation. You can imagine a LOD as a GROUP BY operation! But what does FIXED mean? It essentially ignores all other dimensions except for the dimenions you have chosen. To make this clear I'm going to show you an example later on. Let's get back to our second example and put the LOD expression in our table:
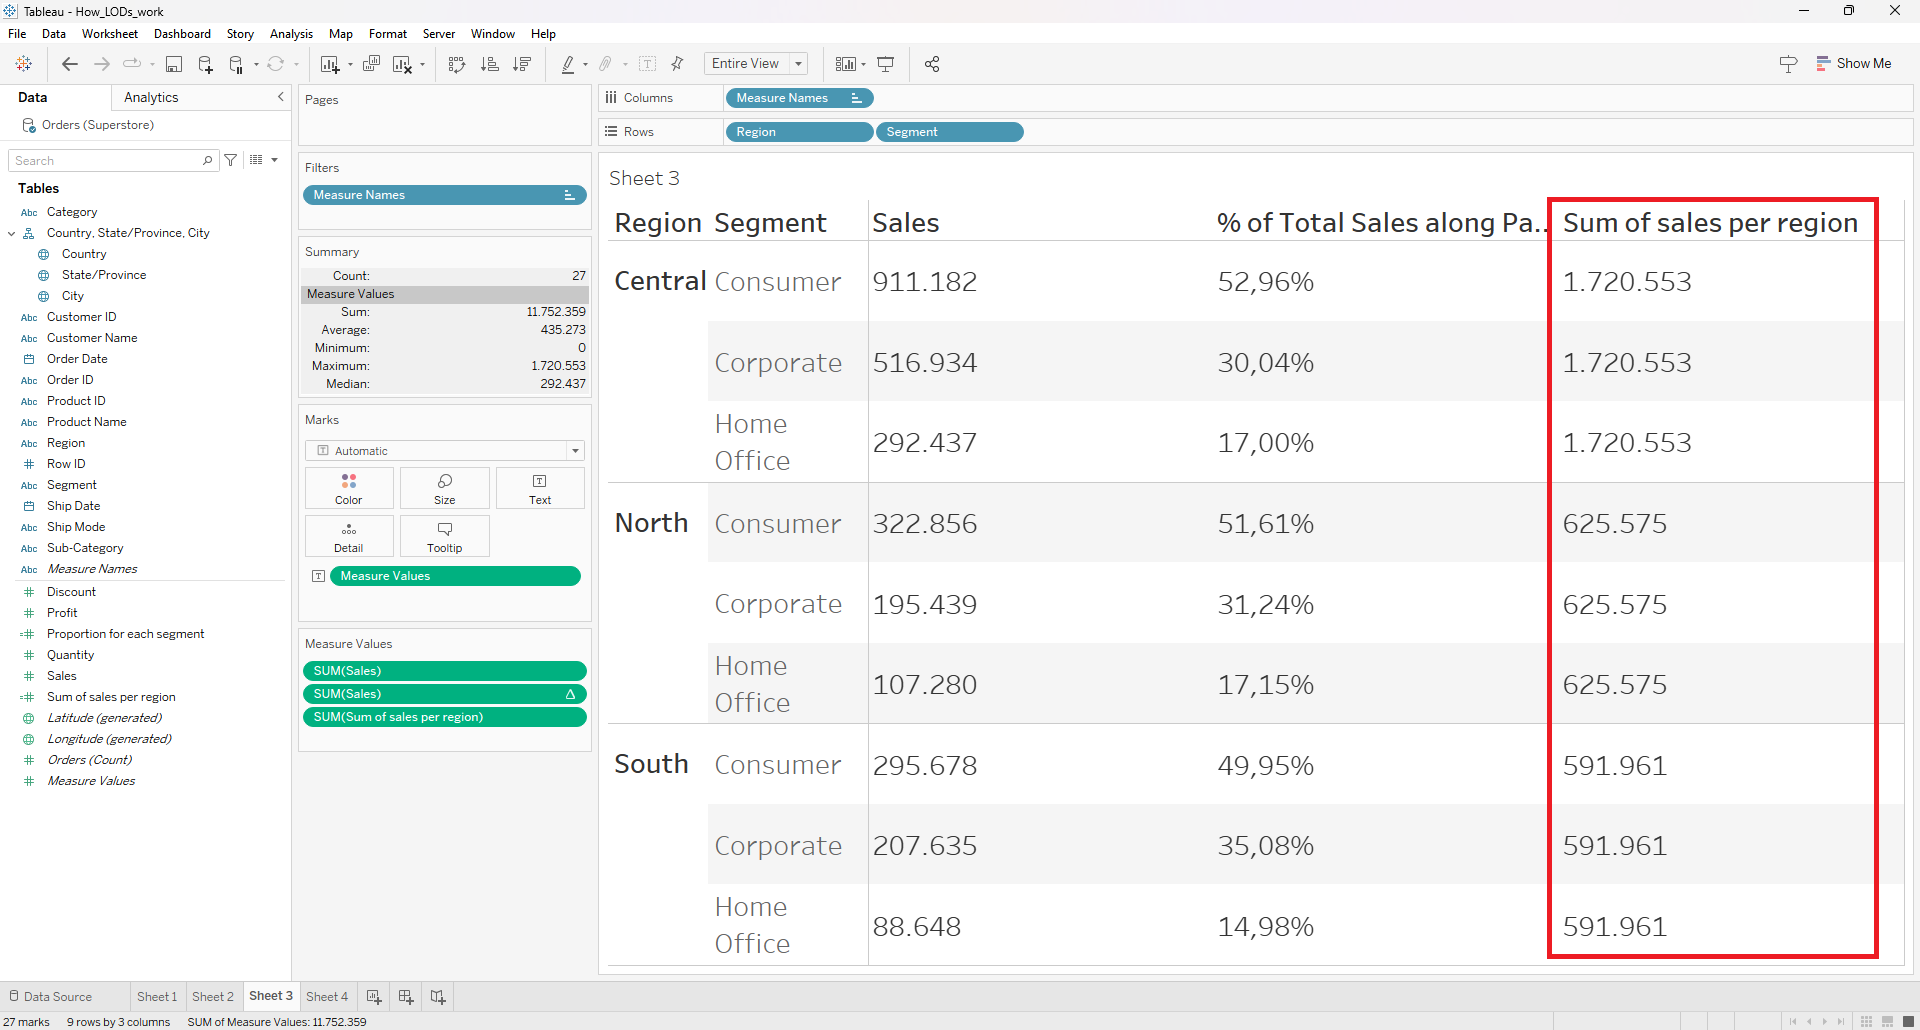
As you can see the sum of sales for each region are repeated for each region seperately. Let's check if our is calculation correct:

Our calulation seems to be correct, so what we're going to do next is creating a second calculated field to calculate the proportion:

Let's put this calculation into our table as well:
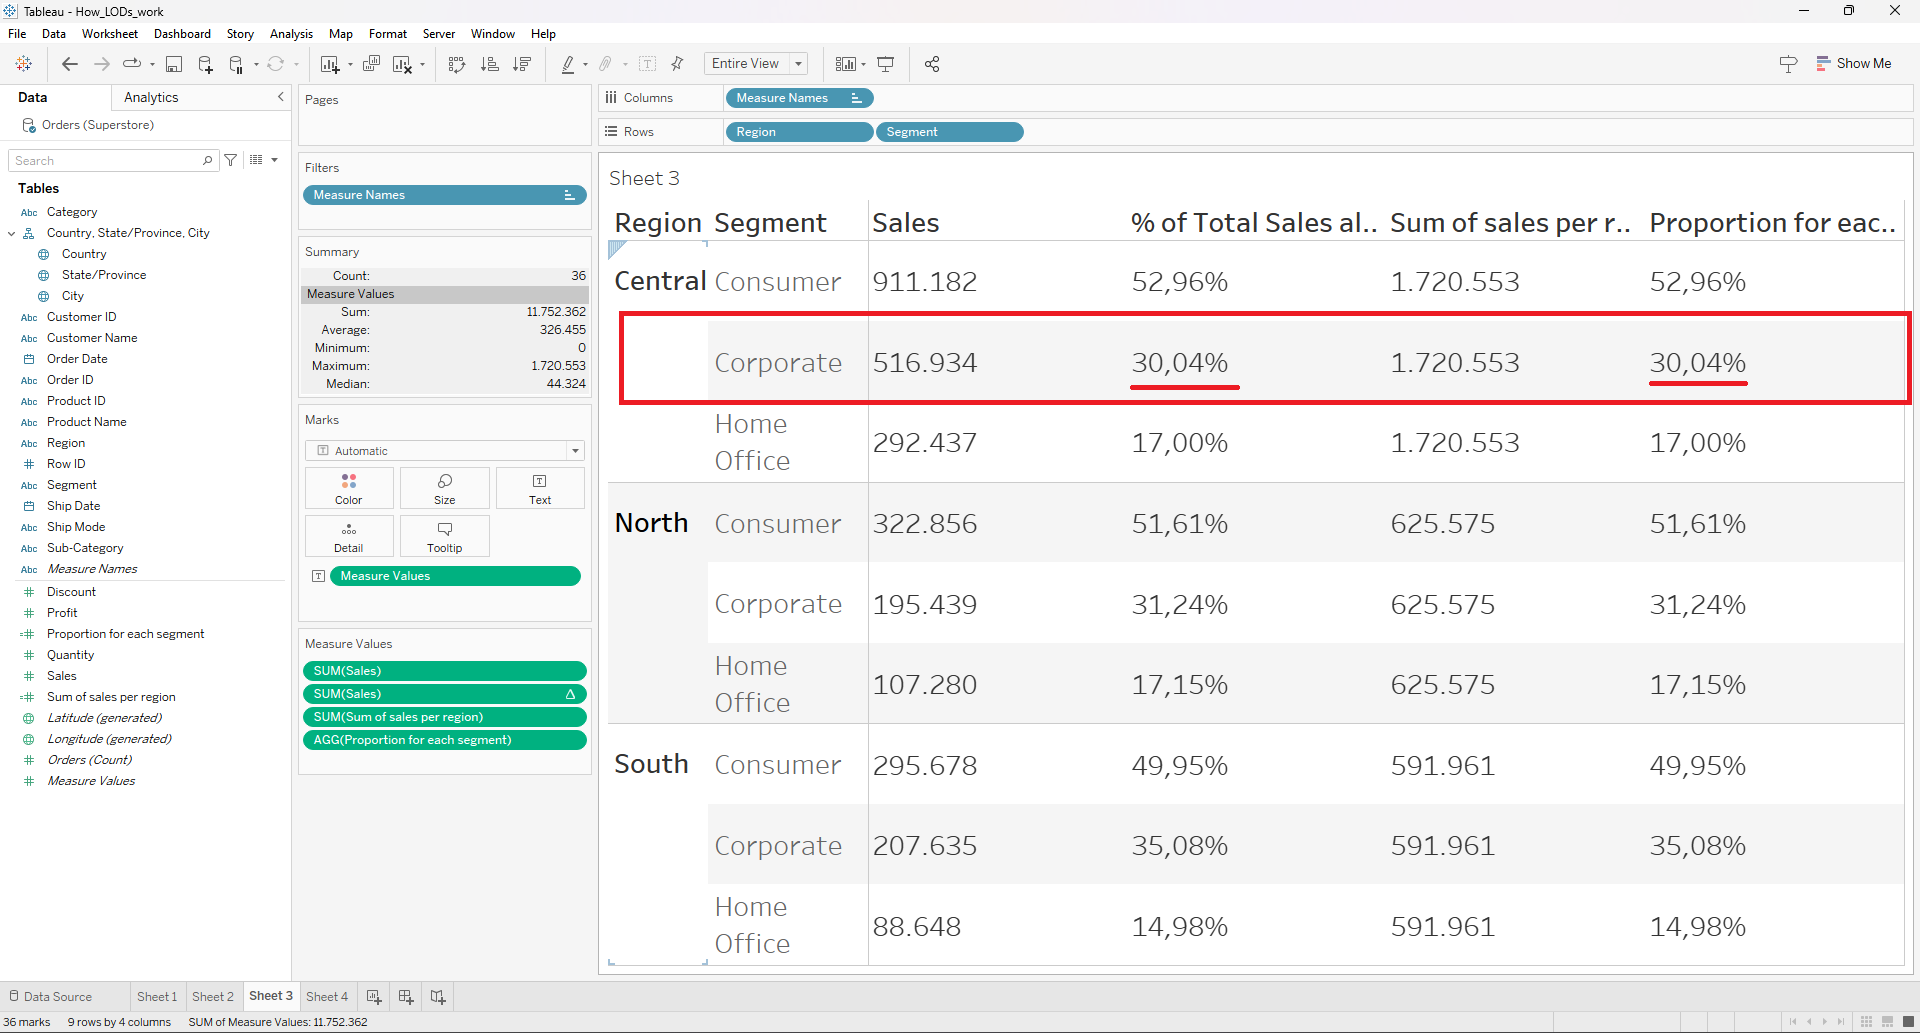
As you can see the result of the proportion function we've just created is equal to the table calculation but the big difference is shown in the picture below:

The result of the table calculation has changed again whereas the result of the proportion function I created has still the same value and this is because the overall sum of sales per region is still the same, it hasn't change!
As I mentioned above I explained what FIXED actually means and now I want to show you a simple example to make it clear because if you don't know you can build many weird things in the view.
I just created a LOD calculation to get the sum of sales by segment but before we get into the results let's consider the sum of sales by segment:

So now let's drag the sum of sales into the table and the calculated field I've just created as well:
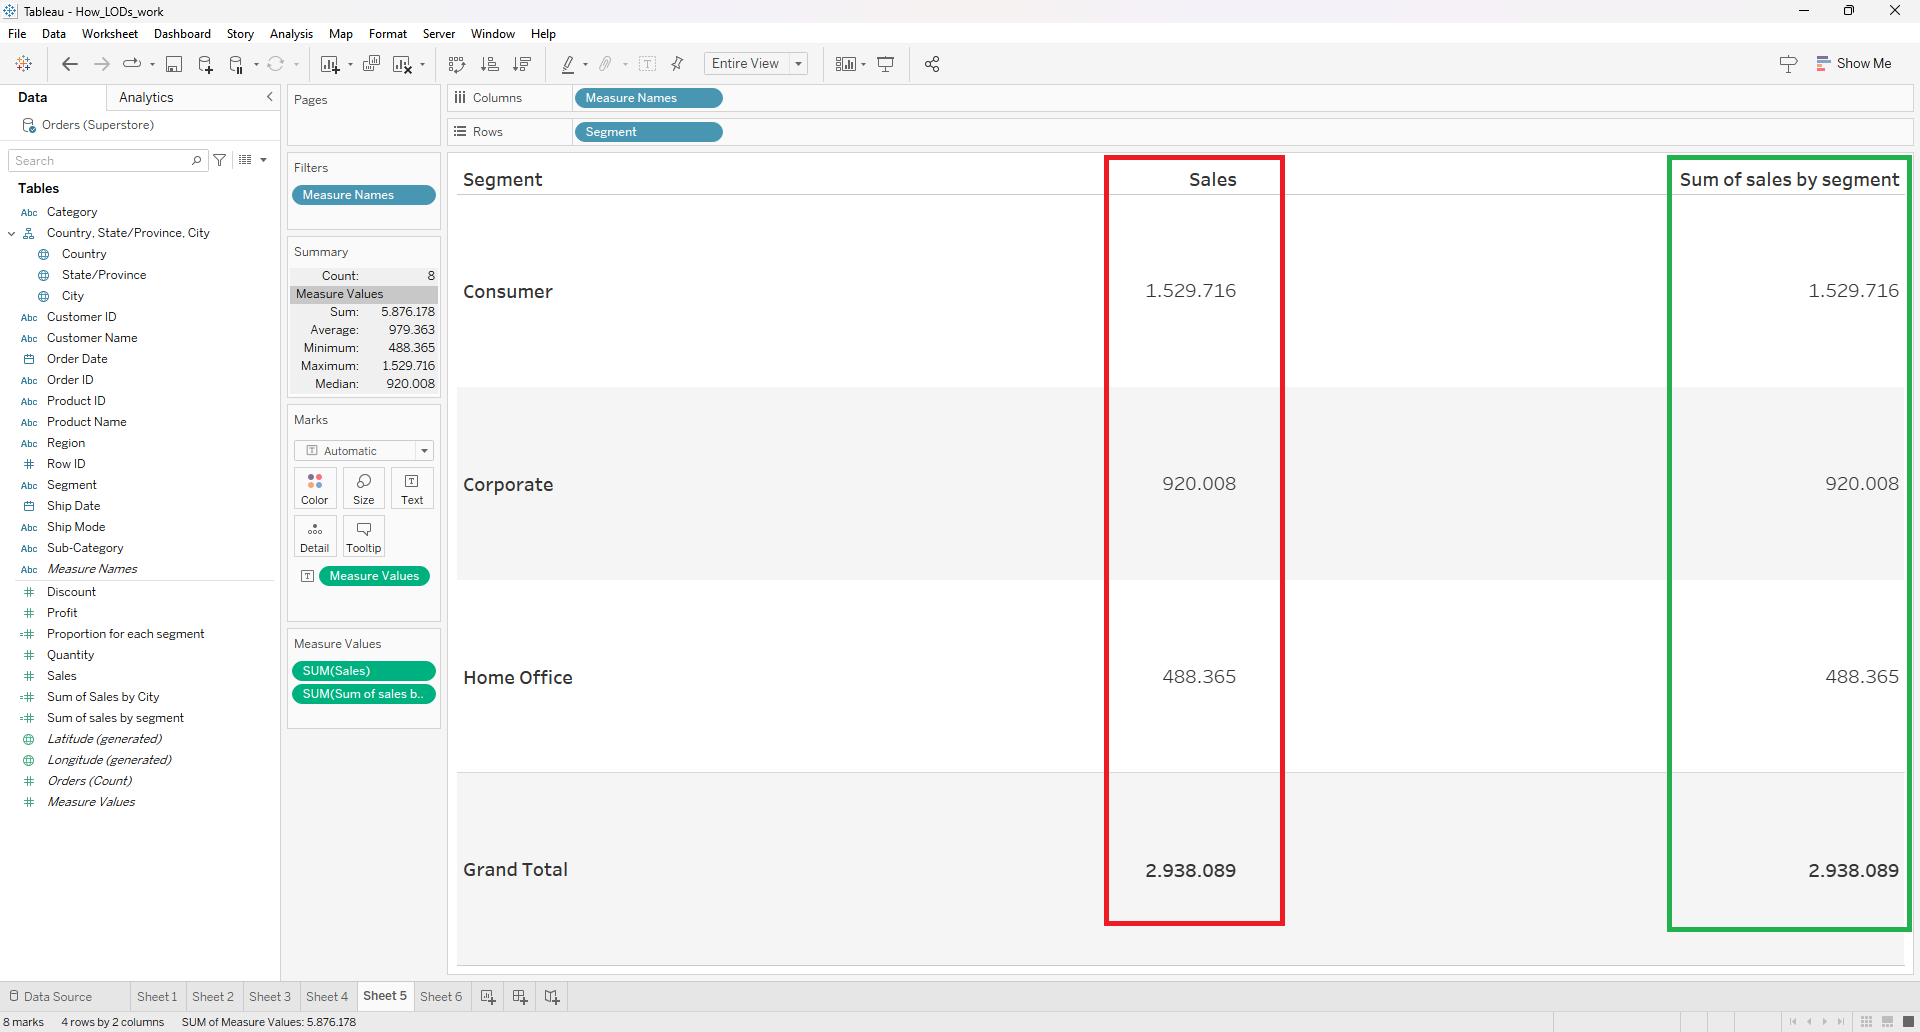
So far, both calculation, sum of sales (red) and the LOD calculation (green) are equal. But now what I'm going to do is dragging "Region" into the row shelf:
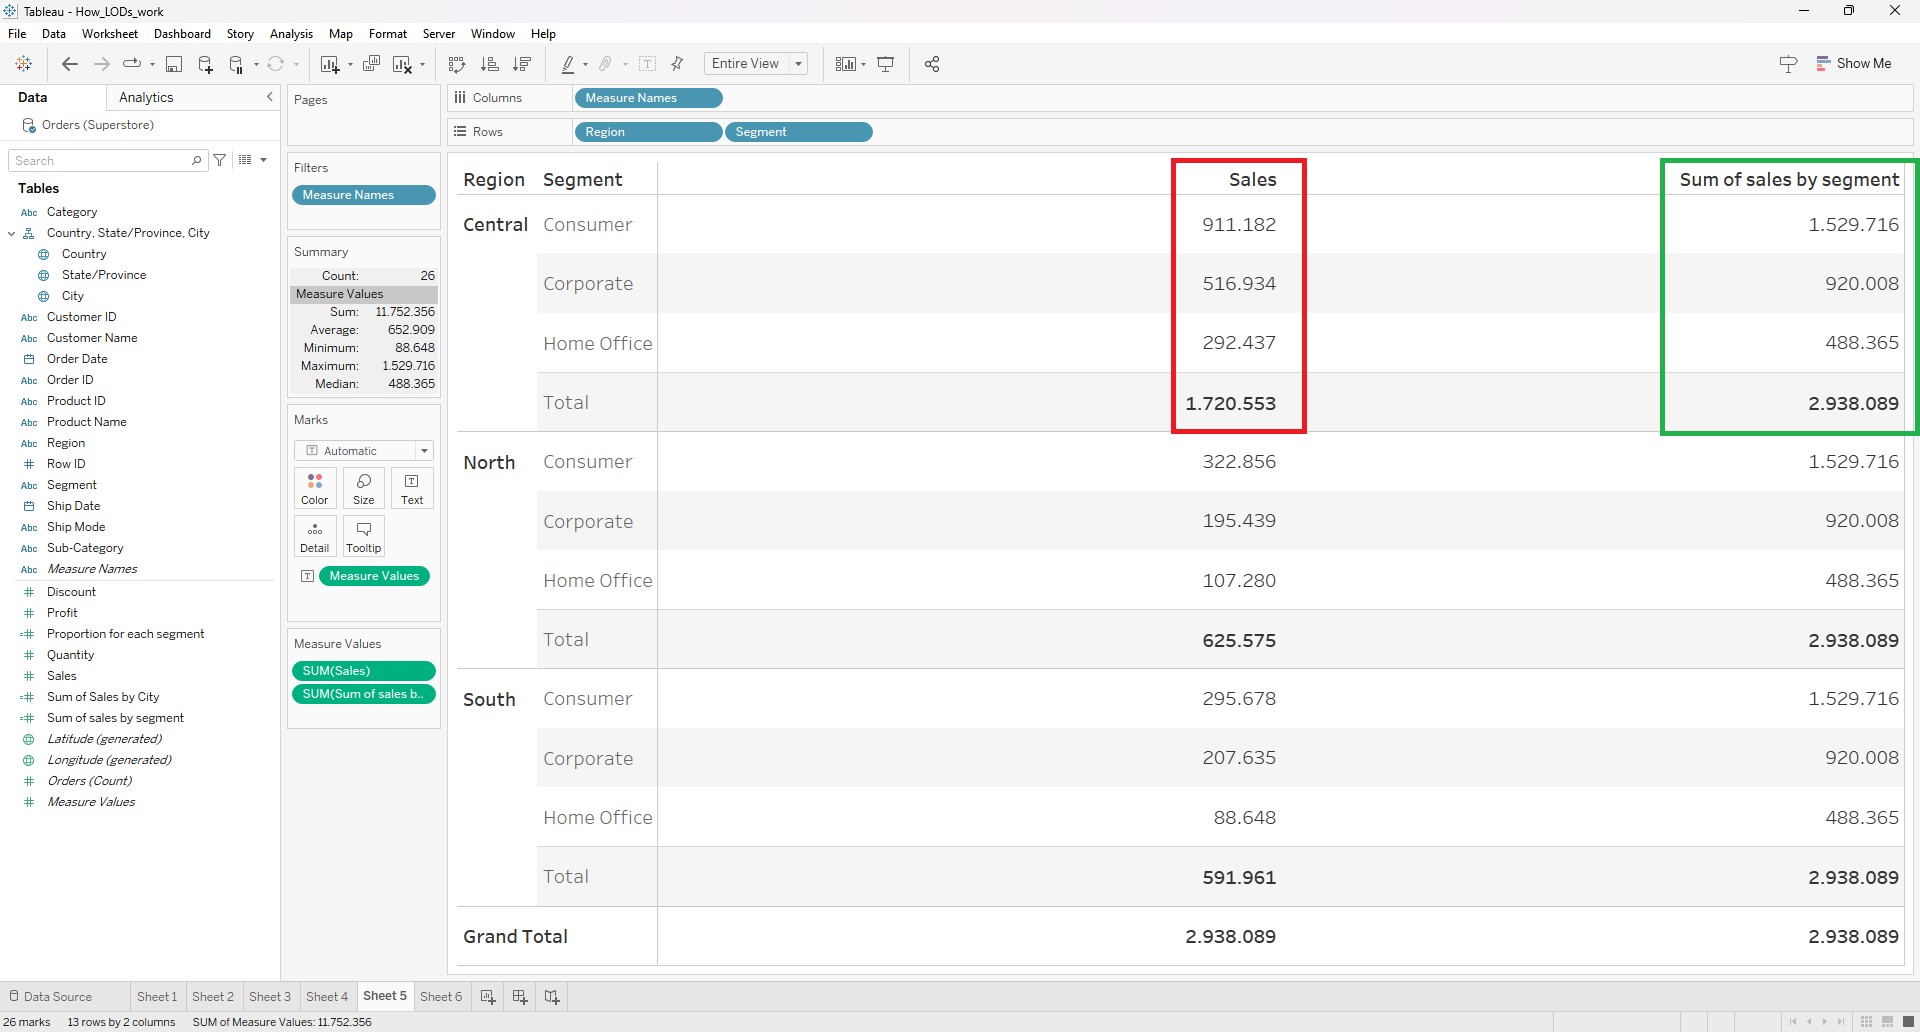
It's obvious that the LOD calculation (green) essentially ignored the dimension "Region". The numbers havn't changed compared to the numbers (green) in the table before.
