


As a first tip of the week, I want to focus on a Tableau issue that I encountered while I was studying for the Tableau Desktop Qualification exam.
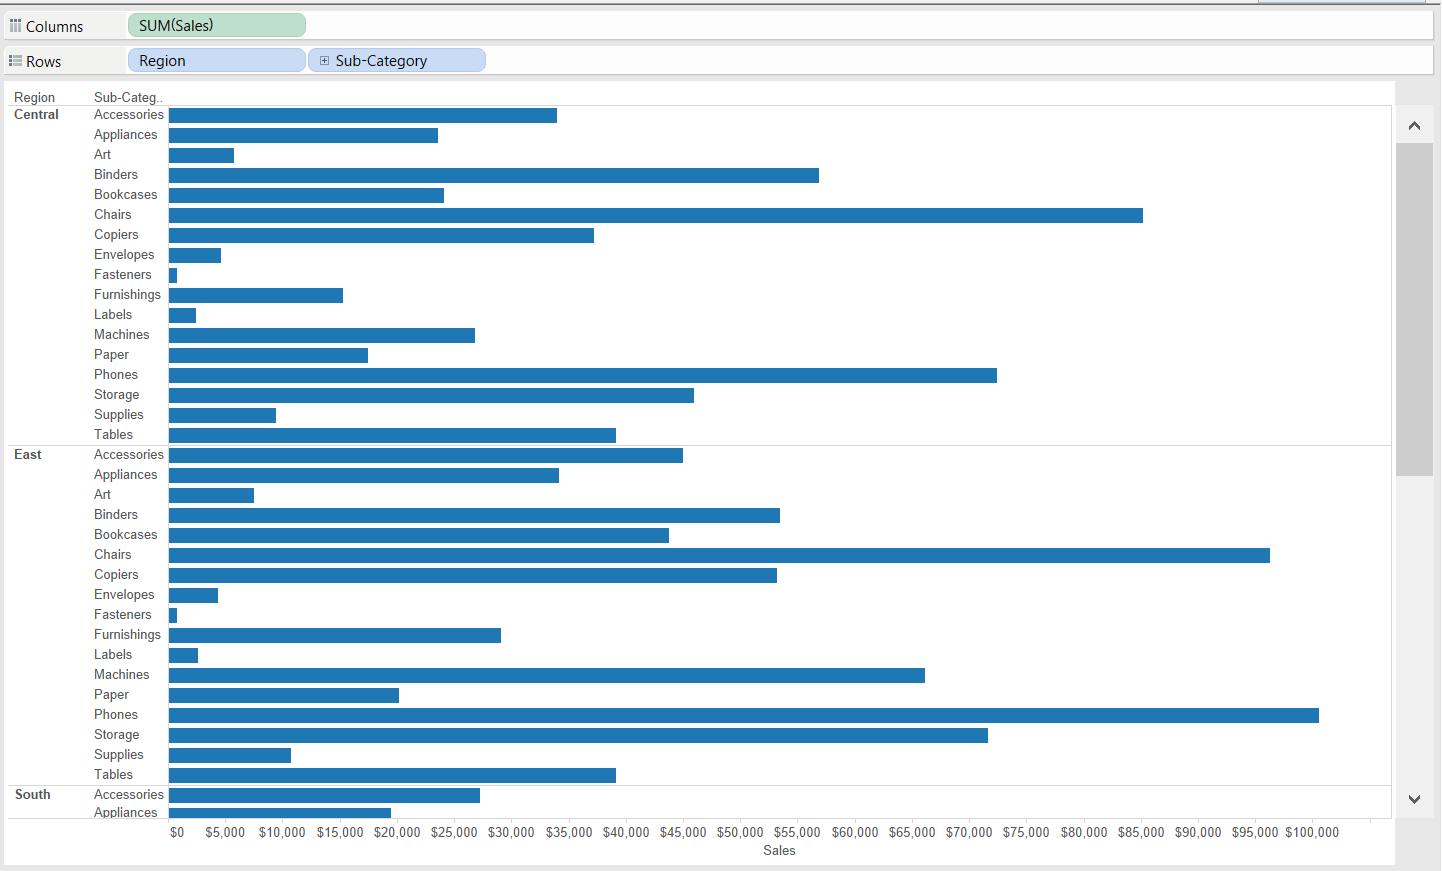
In our Sample Superstore data, I drag region and sub-category on rows and sales on columns.
What do I get?
Now for each region of US, I want to see the top three sub-categories I am selling to.
I have recorded a video to show that.
Let’s have a look:
So you basically create a index that rank your sub-categories. Then you edit your table calculation and you create the correct settings.
After that, you convert rank to discrete and drag it into rows.
At the end you drag rank into filter (first you convert it to continuous) so you can decide the top N you want in your view.
I hope this is useful!
See you tomorrow!