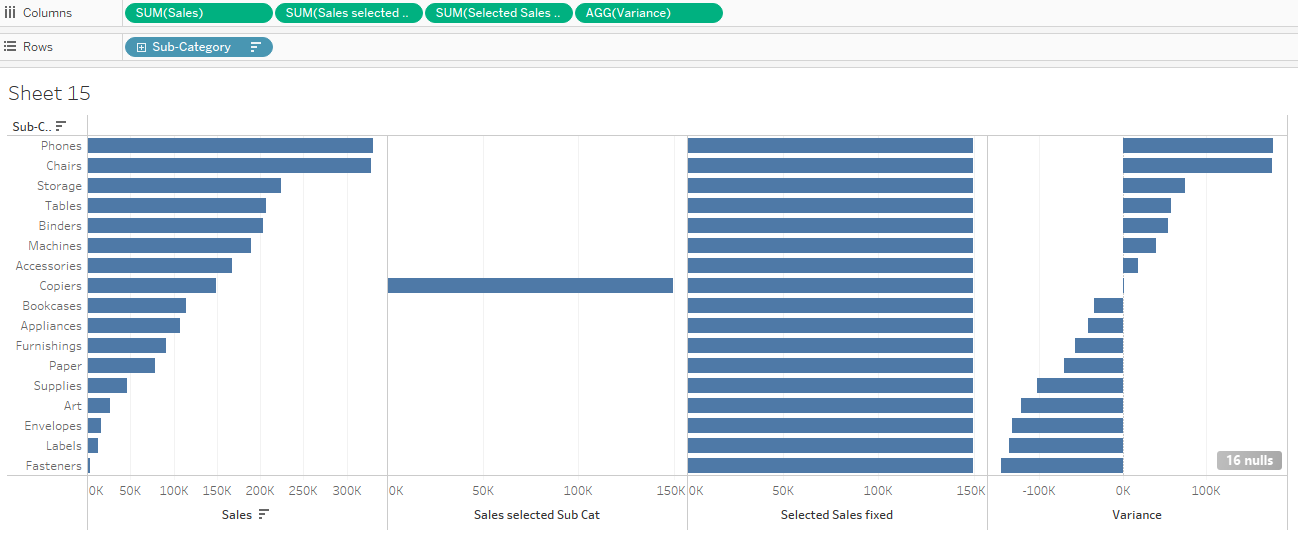
What is an variance chart? It shows the difference from, for example the sales, of a selected category to the other categories. It could look like this:

There are several ways to build a variance chart. This post will cover the ways with a
- LOD
- Table Calculation (complex)
- Table Calculation (easy)
and describe some pros and cons of these methods.
LOD
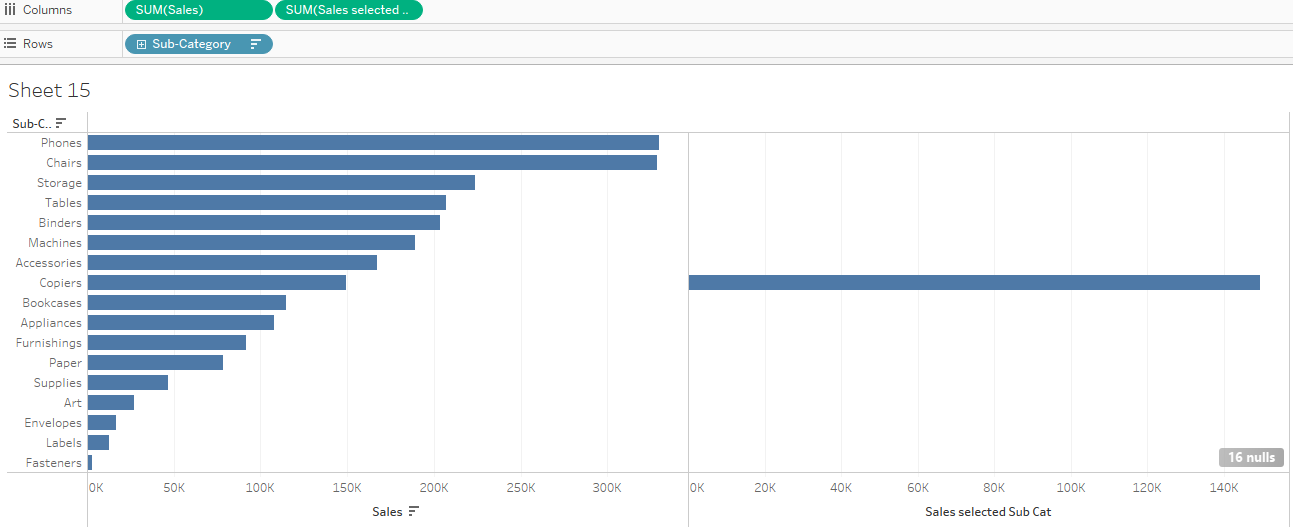
- A parameter on the the dimension we want to compare, for example Sub Category.
- Get only for the Sub Category, selected in the paramter, the sales.
Selected Sub Cat
// Calculation to get the sales for selected Sub Cat
IF [Sub-Category Parameter] = [Sub-Category]
then [Sales]
else 0
END

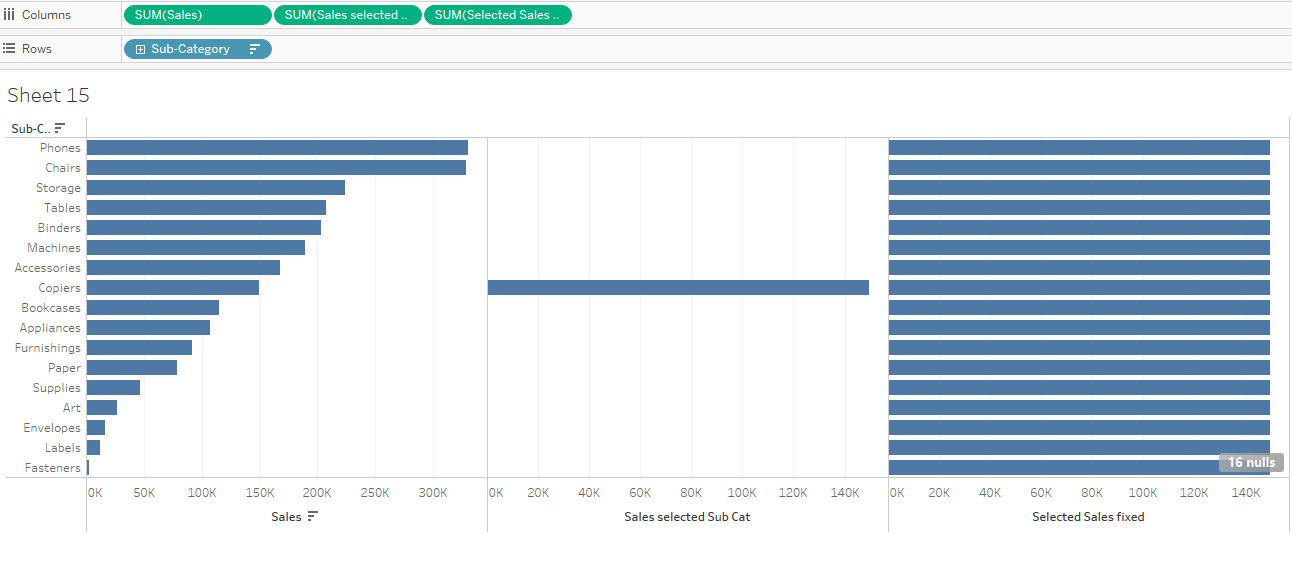
- Assign this value to every other Sub Category i.e. those which are not selected in the parameter.
Selected Sales fixed
// Fix the sales for everywhere in the view
{ FIXED : sum([Sales Selected Sub Cat])}

- Substract the actual value from the value in step 3.
Variance
// Substract the values in the rows from the fixed value
SUM([Sales])- SUM([Selected Sales fixed])

Considerations:
- it works really well
- through the calculations is another user able to understand the logic
- but filters won't affect the fixed, if they are not context filters
Table Calculation (complex)
It is basicallly the same as the LOD. The only difference is how to calculate the totals.
Use the same calculated field like for the LOD.
Selected Sub Cat
// Calculation to get the sales for selected Sub Cat
IF [Sub-Category Parameter] = [Sub-Category]
then [Sales]
else 0
END
Then set up the table calculation. Total is used to assign the value from the selected Sub Category to the others. Sales is aggregated, because a table calculation refers always to aggregated informations in the view.
Total selected Sub Cat TC
// Calculation to get the sales for selected Sub Cat
TOTAL(SUM([Selected Sub Cat]))
The last step is agian the same like in the option with LOD.
Variance
// Subtract the total value from other sub cats
SUM([Sales])-[Total selected Sub Cat]
It looks at the end the same like the LOD.
Considerations:
- it works really well
- through the calculations is another user able to understand the logic
- normal filters work - no context filter is necessary
Table calculation (easy)
This option is a little bit different. It doesn't require any calculated fields, it makes use of prebuild table calculations in Tableau.
- It requires the same Sub Category parameter like the other options
- Bring Sub Category on Rows and SUM(Sales) on Columns
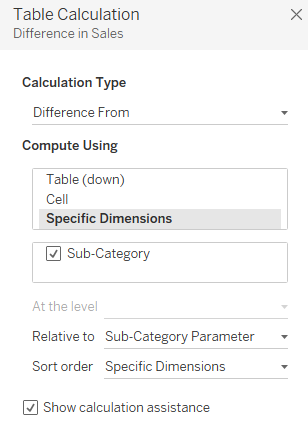
- Add a table calculation on sales and select "Difference from"
- On Specific Dimensions check Sub Category
- On relative to select the Sub Category Parameter
- Thats it.

Considerations:
- it works really well
- no calculated fields can make it easier or harder to understand
- normal filters work - no context filter is necessary
