In this post I want to explain how to build a quadrant chart. So what makes a quadrant chart? Imagine you want to know how a specific group of your customers is composed. For example: You are the CEO of the Tableau Superstore and you want to know which customers are your top 100 customers by sales AND which of these customers belong to the group of top 100 by profit ratio. This composition of customers by 2 measures can be easily displayed in a scatterplot with colored dots - depending on the group.
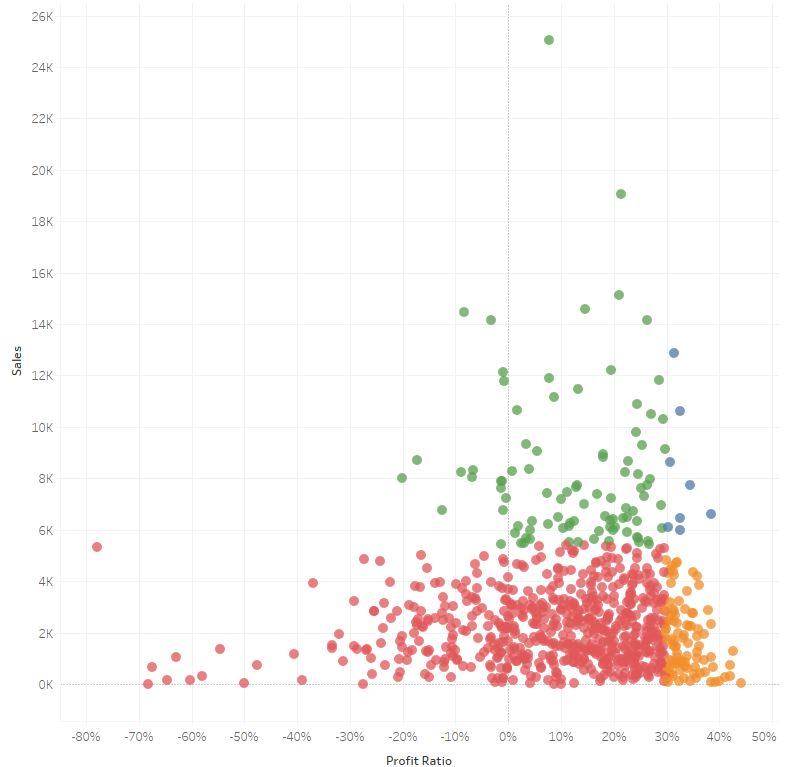
This is the goal:

The customers which belong to both groups are blue, the ones who are top 100 by sales, but not top 100 by profit Ratio are green, the orange dots represent the customers who are not top 100 by sales and profit ratio, but are at least top 100 by profit ratio. Red is the rest.
So how to build the chart: What we need are sets. Sets are a subset of values from a dimension - selected manually or by a condition. A Set is always based on a dimension. The dimension in our case is the one that is important in our chart, i.e. the customer ID. Create a Set and set it on top 100 by SUM(Sales). Duplicate this set and also pick top in the menu, but now for the profit ratio and set the aggregation type on average.
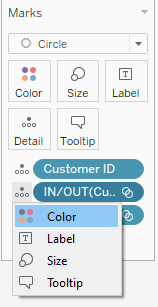
Now when we have these two sets we can build our quadrant chart. First build a normal scatterplot with sales and profit ratio and customer ID on detail. Pretty simple so far. But now is the time for the sets, we just created. Bring both of them on detail and bring them both to colour. (Click on the little detail symbol and change it to colour)

If both sets are on color the chart is colored in 4 colors - for every combination of the sets. You can change these colours to make the message clearer, but that it is!
Important note: In memorization to the order of operations in Tableau it is important that your filter - if you want to filter - is a context filter. Otherwise the Set ranks higher in the hierarchy and you get a wrong result!
