


Tableau offers the possibility to fix an axis. This has different advantages, but from it's strenght, and that's in the name, it ist fixed. It is always, always, always the same unless you change it.
There are some usa cases where you need to fix an axis dynamically. This might sound strange but what if you compare for example bars in a butterfly chart.
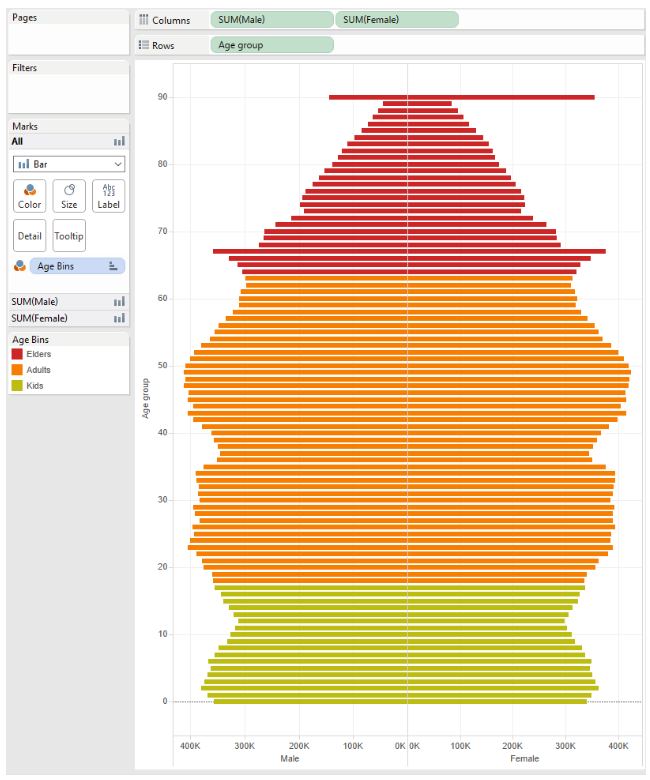
Here it is crucial, that on the left and right hand side of the zero the axis have the same lenght, that the bars are comparable.
To do this dynamically, for example if you have different dimensions you want to compare, reference lines can help.
With the WINDOW_MAX function you look up the highest value on the left and right side up and take this value for your reference line. Depending how your chart is build it can happen, that you have to multiple the maximum with -1.
To get the higher value (of left and right) you have to compare them and then pick the higher one.
IF WINDOW_MAX(SUM([Linker Wert])) > WINDOW_MAX(SUM([Rechter Wert]))
THEN WINDOW_MAX(SUM([Linker Wert])) *-1
ELSE WINDOW_MAX(SUM([Rechter Wert])) *-1
END
Put the result of this calculation on detail so you can access the information with the reference line.
Select calculated field in the reference line, set the label and line to "None" so that the line itself is invisible. Nevertheless it is in the chart and the axis on the left and right side have the same lenght and will update when new data come in.