


For this blog I wanted to cover what we learnt last week on the dates data type in Tableau, covering the basic fundamentals alongside a calculated field trick I learnt on a data prep challenge. To start with, dates in tableau act as a distinct data type and unlike intergerns or strings carry an intrinsic hierarchy and a host of unique functions and manipulation techniques.
First of these techniques, is using right click drag when moving dates onto your rows or columns. This prevents Tableau from automatically assigning the date to a category and instead allows for selection of how you want your dates presented.
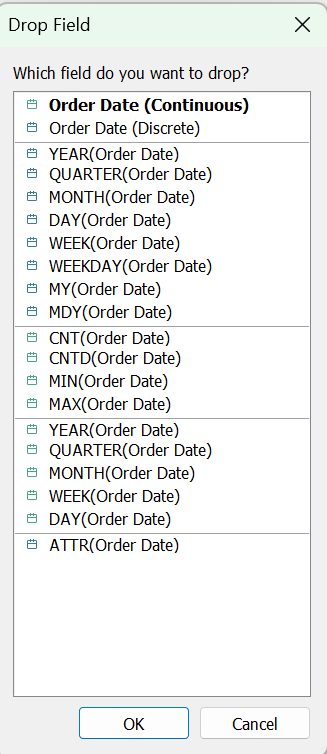
As you can see from the image above, dates can be both Green (Continuous) or Blue (Discrete). Blue dates create headers whilst Green dates create axis.
For Blue dates, Tableau treats the date parts as separate, distinct buckets. For example, if you select discrete "Month," Tableau will group all Januarys from every year into a single column. This is perfect for comparing seasonality across years.
Conversely for Green dates, Tableau treats the date as a continuous timeline. If you select continuous "MONTH" it will plot your data chronologically from January 2024 to December 2026 on an unbroken line. This is the choice you want for tracking historical trends.
Next I wanted to do a brief overview on three important functions when using dates.
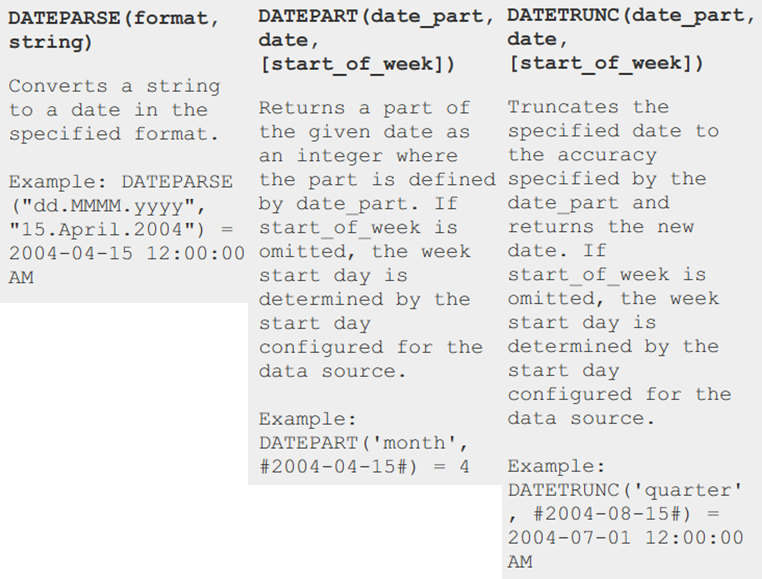
While the exact mechanics of how these work are illustrated in the image above, there are a couple of fundamentals to keep in mind. First, Tableau natively stores dates in a standard yyyy-mm-dd format, which is why you see DATETRUNC and DATEPARSE outputting or interacting with dates in this specific structure. Second, just like we use quotation marks "" to tell Tableau that a piece of text is a String, we use hashtags ## to denote a literal Date (for example, #2026-05-18#). Another Tableau quirk is that start_of_week defaults to Sunday, so that has to be manually adjusted if you want something different.
Now that we know the basic syntax why would you want to use these functions?
DATEPARSE use case:
You use DATEPARSE when your dates are trapped in a string format that Tableau doesn't automatically recognize (such as "24/10/26" or "Oct-26"). Instead of manually writing string manipulation formulas to slice up the text, DATEPARSE lets you define the exact structure of your incoming data and safely converts it into a true, functional date data type in one clean step.
DATEPART use case:
You use DATEPART when you want to isolate a specific chunk of a date, like the day of the week and obtain said value as an integer. It allows for pulling out specific segments as independent integers. This is another method of transforming the date data type into something different in this case an integer value.
DATETRUNC use case:
You use DATETRUNC when you want to round down a date to a specific granularity. It's useful for grouping dates by month or quarter or for removing lower level detail from a datetime column. Importantly, the output is still kept as a date data type.
Tableau Prep Task
Now whilst this task is not directly linked to the functions I've explained, it's still interesting and gets the point that often with dates there's a clever way of doing things rather then using a brute force method.
For this task we had to create a calculated that would assign students an academic year based on their date of birth. For students born after 01/09/2014 they are to be assigned year 1 and so on. Given the data only included 5 years worth of students the solution could be brute forced without the use of any date specific functions...
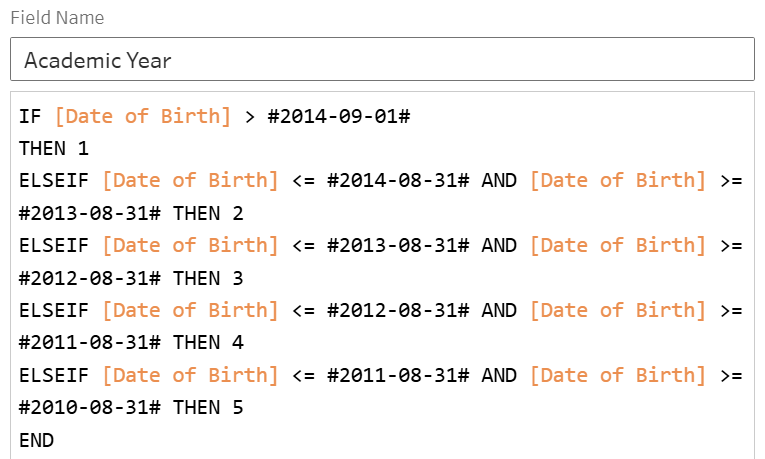
However, this solution lacks scalability and takes a long time to type out!
A far better solution involves using the functions that tableau provides us with a nice elegant solution which fits neatly onto one line.
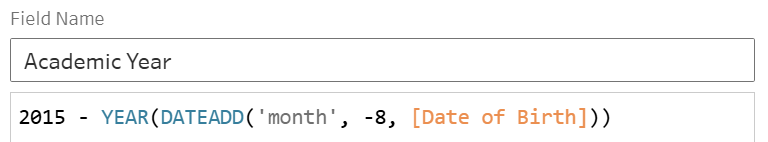
For this question the school year runs from September to August. What the DATEADD function does here is move anyone born between January and August be pushed back to the previous year e.g 15/08/2014 -> 15/12/2013. This moves the academic cutoff to January. The YEAR function then extracts just the year from that date as an integer. So for our previous example, YEAR would return 2014. This leads to our calculated field giving an academic year of 2 as we wanted.
Now if ever we have new years added into the data they're academic year will be automatically inputted without having to add a new if statement each year.
Overall, Dates are one of Tableaus most complex but powerful data types and appear throughout a huge range of datasets. Making use of the functions specific to Dates allows for a great degree of control and flexibility with how we handle them.