In several companies, sales territories are based on pre-defined areas. These may be hand-drawn aggregations of postal areas, states, or perhaps more familiar geographic regions.
This a priori method of allocating sales territories will more often than not result in large disparities in opportunities among salespersons, potentially leading to unrest and friction within your workforce. Some salespeople may have access to an area with more or bigger prospective customers than others.
This is the exact problem myself and Will Griffiths faced in a recent piece of client work for a financial services group in the UK.
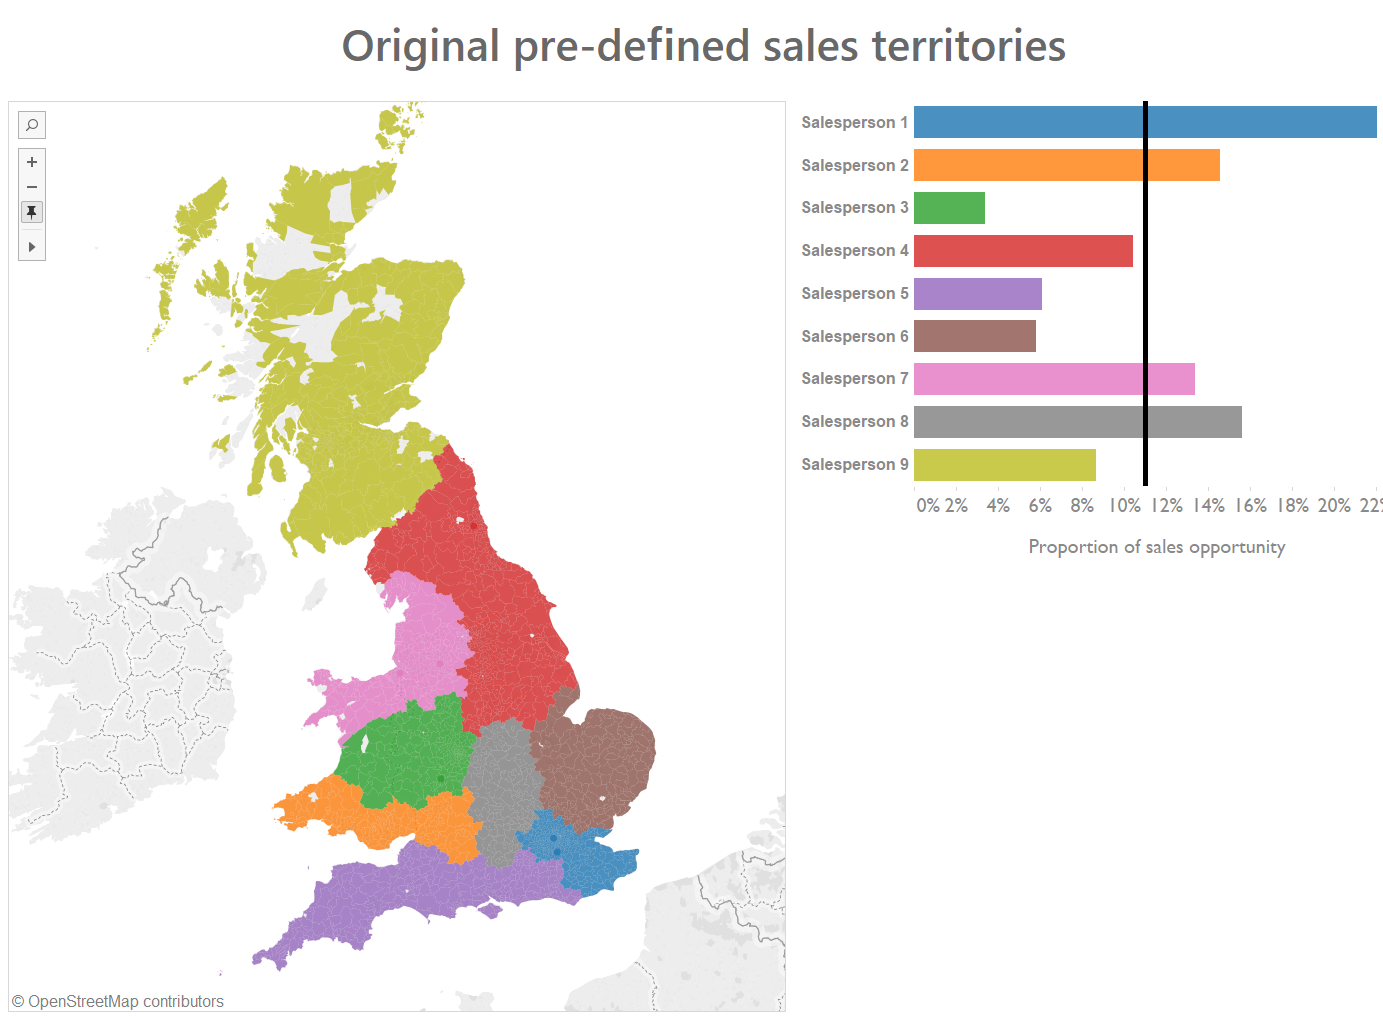
Below is their pre-drawn sales territory map based roughly on regional boundaries. The bar chart to the right shows the resulting equity (the reference line represents complete equity) in sales opportunity– defined here as sum turnover of all the prospective businesses in each salespersons area. As you can see, there are big differences in potential sales among salespersons. Salesperson 1, whose territory encompasses London has access to more (and bigger) prospective customers than other salespeople. Meanwhile, Salesperson 3 has a somewhat of a harsh deal. Although their territory encompasses a greater areal extent than Salesperson 1, they are limited to rural mid-Wales, where sales opportunities are likely to be sparse.

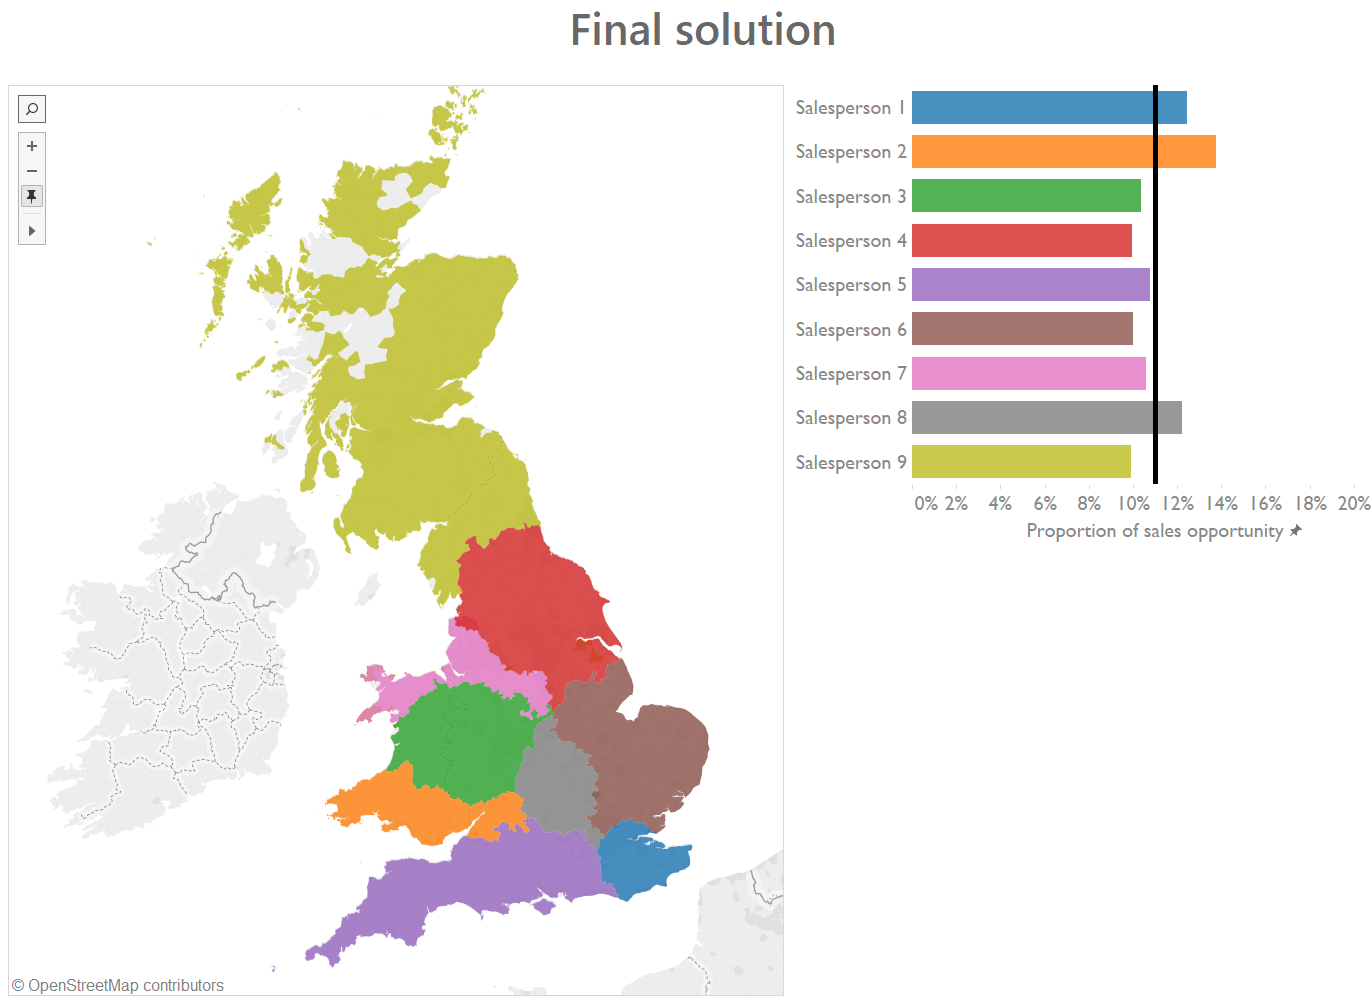
To resolve this issue we need to re-scale sales territories in a way that each area contains equal sales opportunities. This may be defined as sheer count of prospective customers, sum turnover of these customers, or some other metric. Additionally, this map needs to be flexible. It needs to be responsive to new data coming in, as prospective customers are added/removed from the list or their details are updated.
Alteryx has an impressive array of spatial analytics tools, and it seems that mapping of ‘equitable’ sales territories would be a popular objective among Alteryx users. However, we found that such a process is not simple to carry out using any standard spatial tools. It took a fair amount of experimentation and counselling of Ace’s (Mark Frisch & Chris Love) to arrive at a solution we were happy with.

In the following 4-part blog series we will guide you through the steps we used to arrive at this final solution.
P.S. While the mapping of sales territories will no doubt be optimized by using the drive time engine, we recognize that access to this is a luxury and will base our maps on distances.
Part 2 – Developing a solution
Part 3 – Geo-aggregation algorithm
Part 4 – Refining the solution
