In the previous blog post I walked through the evolution of ideas that led to the concept of a geo-aggregation algorithm for generating equitable sales territories. I also explained how we used Alteryx to prepare the data for this.
In this blog post, I’ll talk you through the design of this geo-aggregation function in Alteryx.
To recap, the geo-aggregation concept is as follows.
We want to build each salespersons territory up around a central point (the centroid of their current territories), and we want to do this in an equitable manner.This means at each step, asking who has the lowest sales opportunity (i.e. lowest sum turnover of businesses in their assigned districts) and allocating them an additional postal district. The district allocated to them will be the one closest to their centroid. The additional postal district will boost that persons sales opportunity, and after the sales opportunities are re-calculated, the process is repeated. We will therefore work through a list of postal districts, assigning them one by one to a salesperson, until the list is exhausted.
To carry out this type of procedure we needed to design an iterative macro.
The finalised macro is in essence quite simple. However, since this was our 1st experience wrangling with iterative macros, it took some jiggling to finally get it to fall into shape. We found it particularly helpful draw out our intended sequence of operations on piece of paper, before trying to execute it in Alteryx.
The Workflow

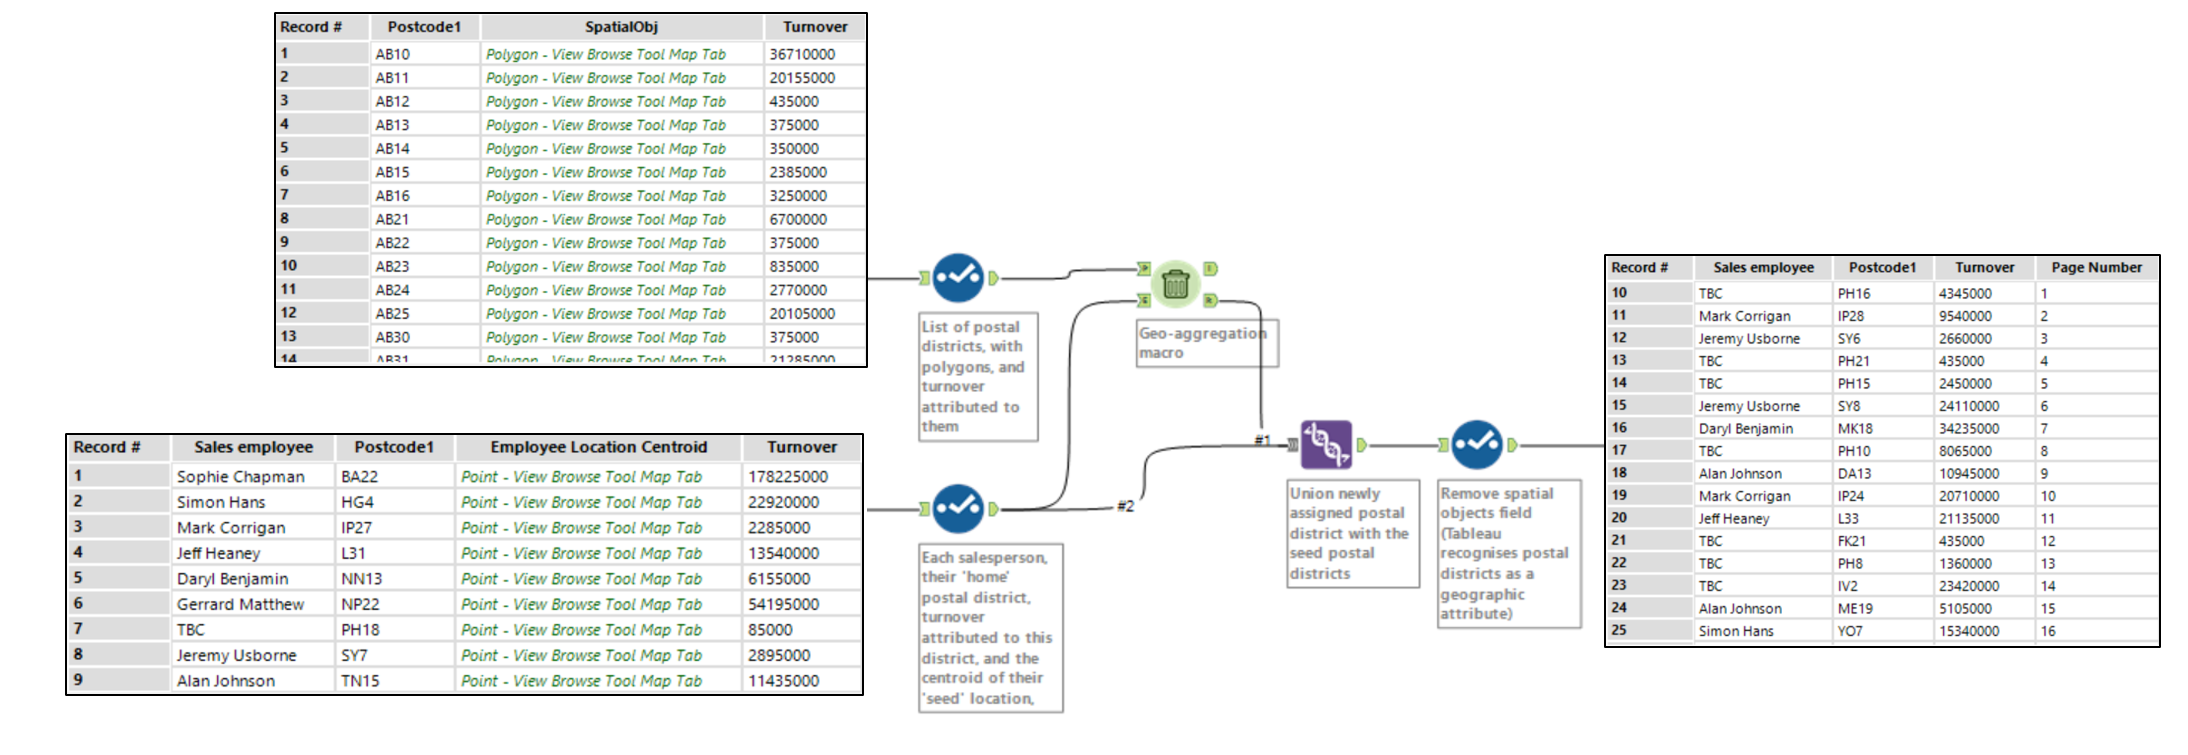
Workflow, showing the 2 inputs prepared in the previous blog post, and the output of postal districts assigned through the geo-aggregation algorithm. OPEN IMAGE IN NEW TAB TO ENLARGE.
It starts by bringing in two different sources of data. The top one being a list of postal districts, alongside the turnover attributed to that postcode and a spatial object that represents the polygon of the district. The bottom data source is our list of salespeople. This contains each salespersons name, their ‘home’ postal district (i.e. the district at the centroid of their previous range), turnover for that district, and a spatial centroid for their home location. This home location will act as the seed for which appended postcodes will be clustered around.
The Macro

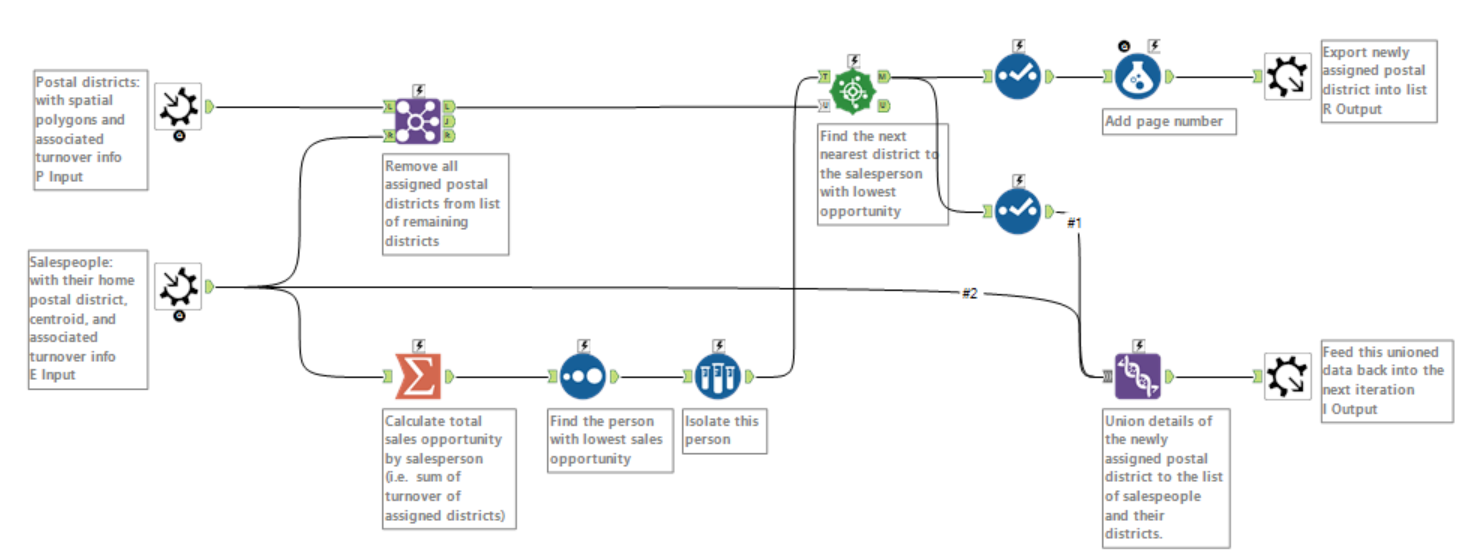
Geo-aggregation iterative macro. The two inputs on the left pertain to the two inputs feeding through the ‘Select’ tools in the workflow above. The output in the top right compiles the list of assigned postal district, while the bottom output feeds back into the next iteration.
The basic idea behind the macro is to start with each salesperson’s ‘home’ postal district, and find which salesperson’s district has the lowest sales opportunity (i.e. lowest sum turnover of businesses within) – this is what is happening in the bottom left branch of the macro (with the Summarize, Sort, and Sample tools). Then, we find the postal district closest to this person’s centroid, and assign it to them – this is what the green Spatial Match tool is doing.
We then iterate this process, taking into consideration our updated information. The salesperson who has just been assigned an additional postcode will now have greater sales opportunity. This means we need to take our newly assigned postal district and factor it into the next comparison of sales opportunities. To do this we bring this postal district down to the bottom stream, and Union it to our list of salespersons districts. Doing so will also, further down the line, enable this assigned district to be filtered from the list of remaining districts. This union-ed data is then fed back into the macro.
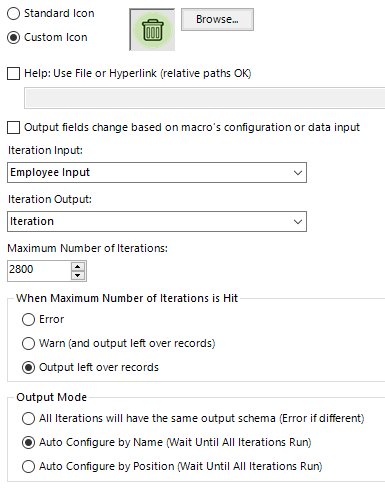
You will notice the macro has two outputs. The bottom output is our ‘Iteration Output‘. This is telling the macro to take our union-ed data and feed it back into the ‘Salesperson’ input for as many times as is necessary to assign every district to a salesperson.
The top output is for end results. This builds up a list of districts assigned to salespeople by the ‘Find Nearest’ tool. I have also added a ‘Page Number’ to each output (this will allow us to generate an animated map to illustrate the macro process at a later point).
The purple Join tool at the start is crucial to the iteration process. Its making sure that districts assigned in the previous iterations are removed from the list of available districts yet to be assigned. At the first iteration of the macro all the postal districts are available apart from the ‘home’ districts. As the macro runs the Join tool will filter out any postcodes that have been matched, until the list has been exhausted.
Settings

Number of iterations: You can see these settings in the above window. We set set the maximum number of iterations to be 2800. This is just above the number of postal districts we have in our database. To improve the performance of the iterative macro it would be better to set an actual ‘stop’ in the workflow, informing the macro to stop iterating when it has run out of postcodes.
Max Radius: Another important setting to consider in the operation of the macro is the ‘Maximum Radius’ set on the Spatial Match tool. If you make this too small, you will be left with unassigned districts out of all salespersons ranges. If you make this too large you risk assigning districts that are unpractical for salespeople to access. In this case we set it at 500 m – a reasonable driving range for our salespeople. However, this doesn’t take practicality of routes into consideration. A drive-time extension would be required to further optimise this.
Output

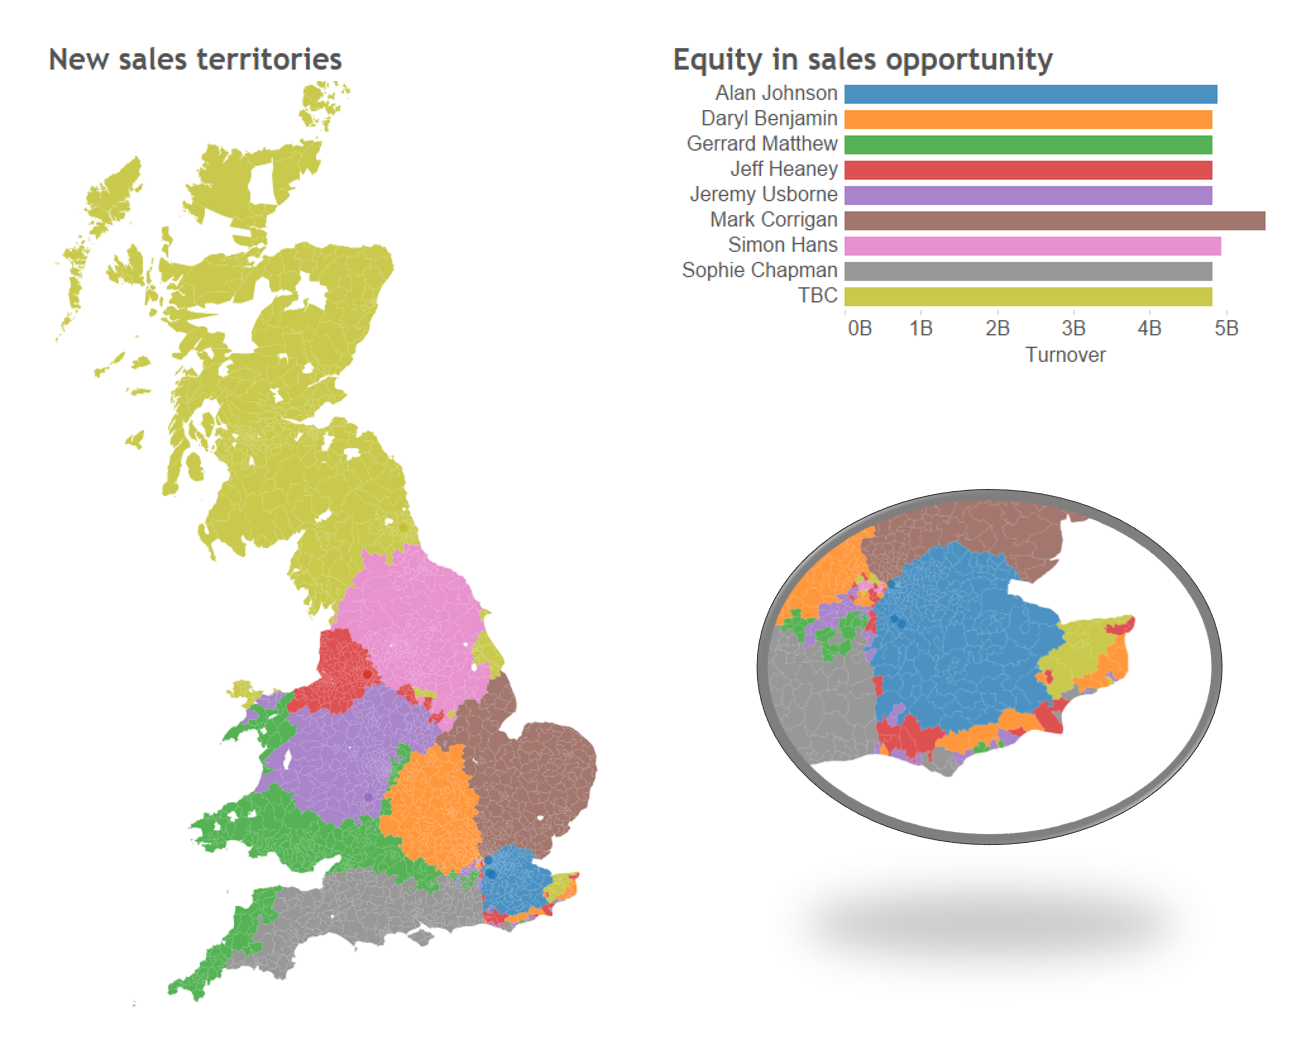
Mapped output of geo-aggregation, and resulting equity in sales opportunity. The oval shows a zoomed portion of the South East UK, to highlight ‘fragmentation’ of territories.
The geo-aggregation output was successful in splitting the UK into 9 chunks of nearly equal sales opportunity! Each salesperson was pretty much allocated a unified ‘blob’, and the sales territories are starting to look good.
However there are a couple of issues:
1. As the iterative macro neared completion, some sales territories became cornered off, meaning the next nearest district to be allocated might have been in a completely different part of the country. E.g. see the zoomed in area in the image above – the fragmentation of districts here is because the salespeople they were allocated to had no more contiguous districts.
2. Some districts assigned to salespeople may be completely impractical for them to access. For instance, see Gerard Matthews territory – much of it across the other side of the Bristol Channel.
So…..we are really starting to get somewhere, but are not finished yet!
In the next and final post of this series I will explain how to re-allocate these fragmented areas to create fully contiguous territories for each salesperson.
