


Power BI can be a useful tool when looking to analyse data directly from a web page. If we identify a web page with a table of data, this can be loaded into Power BI and even subsequently cleaned with Power Query. We would do this following these simple steps:
1) Identify a web page with the data of interest
2) Copy the html link
3) Select 'web page' as the data source within Power BI & add the link when prompted.
4) Carry out any cleaning and analysis, as desired.
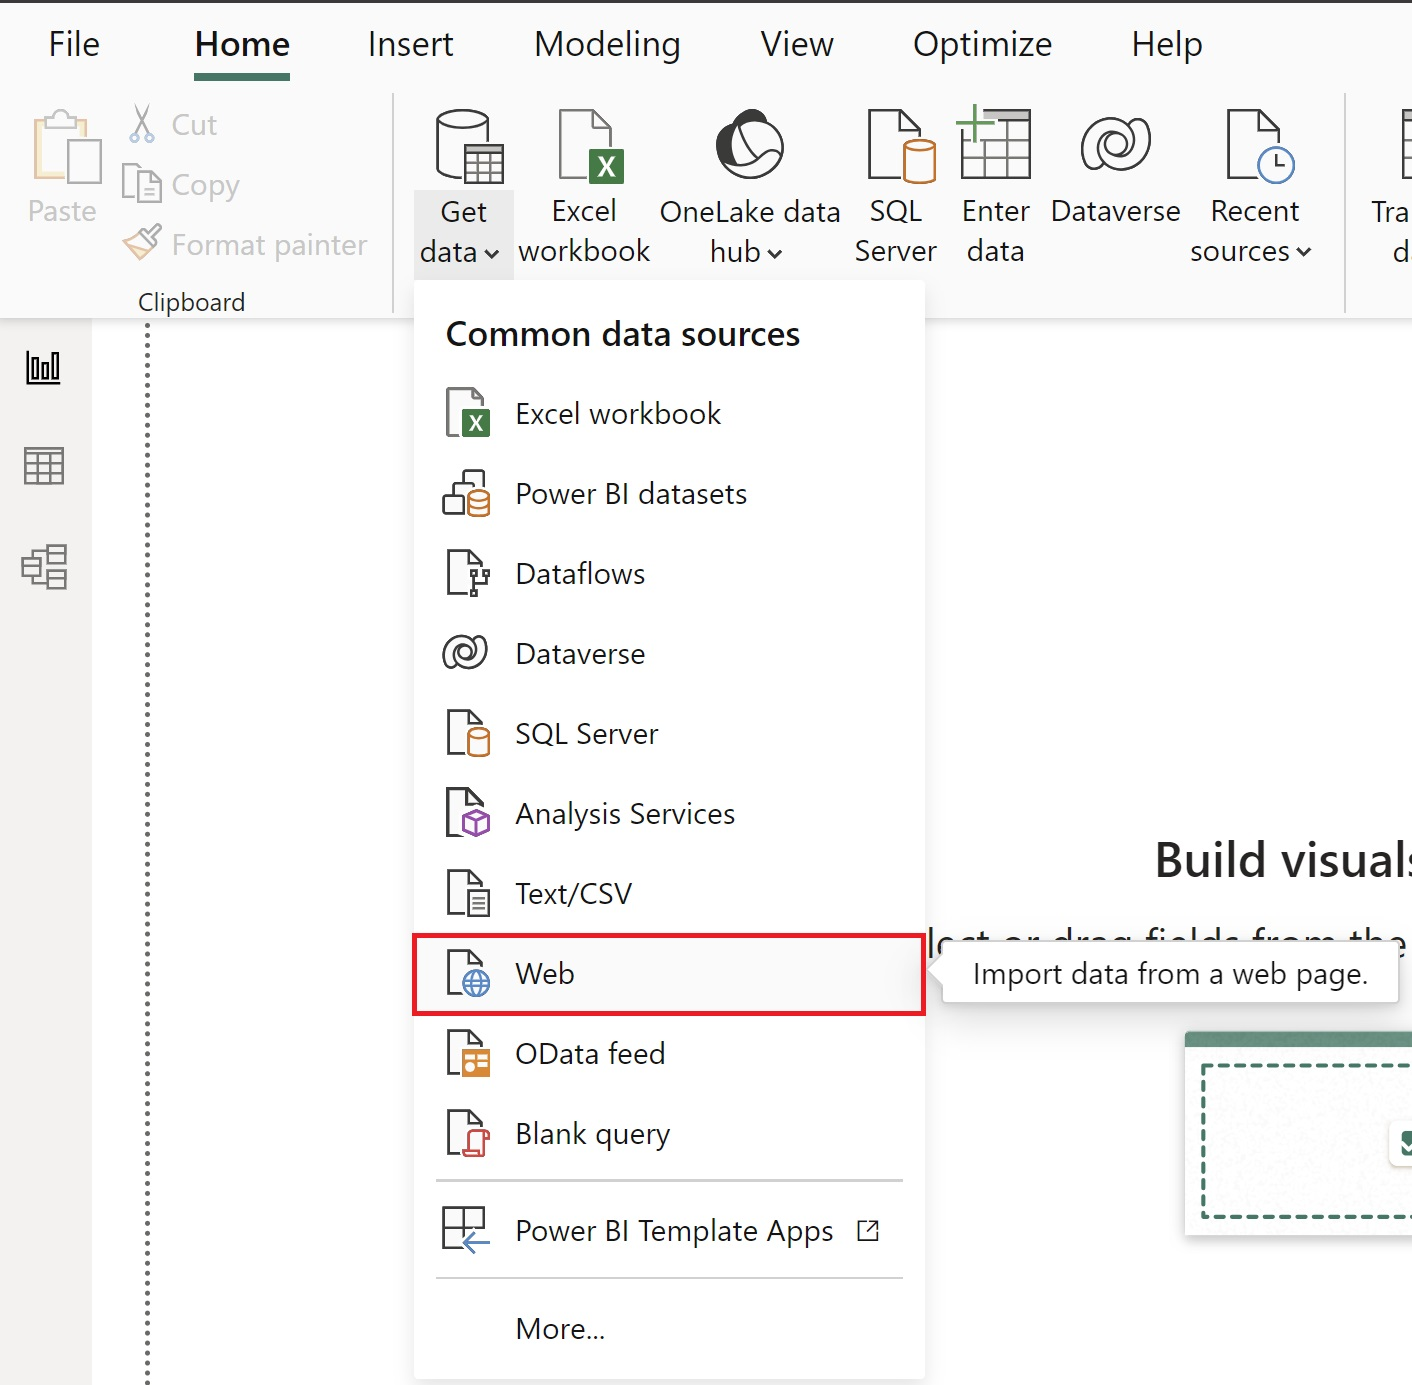
The steps can be seen below. The first step shows where we can find the Web Page option within Power BI.
Once prompted, the below box should be filled with a link to the website in question.

The quality of the data tables that are generated by this function will depend on the way the website is constructed. But, fear not, the data can be cleaned immediately on loading it into the interface.
The example link I worked with is the 100 Best Movies on Netlifx as rated by the 'Tomatometer'. This information is updated regularly - the version I accessed was from October 2023.
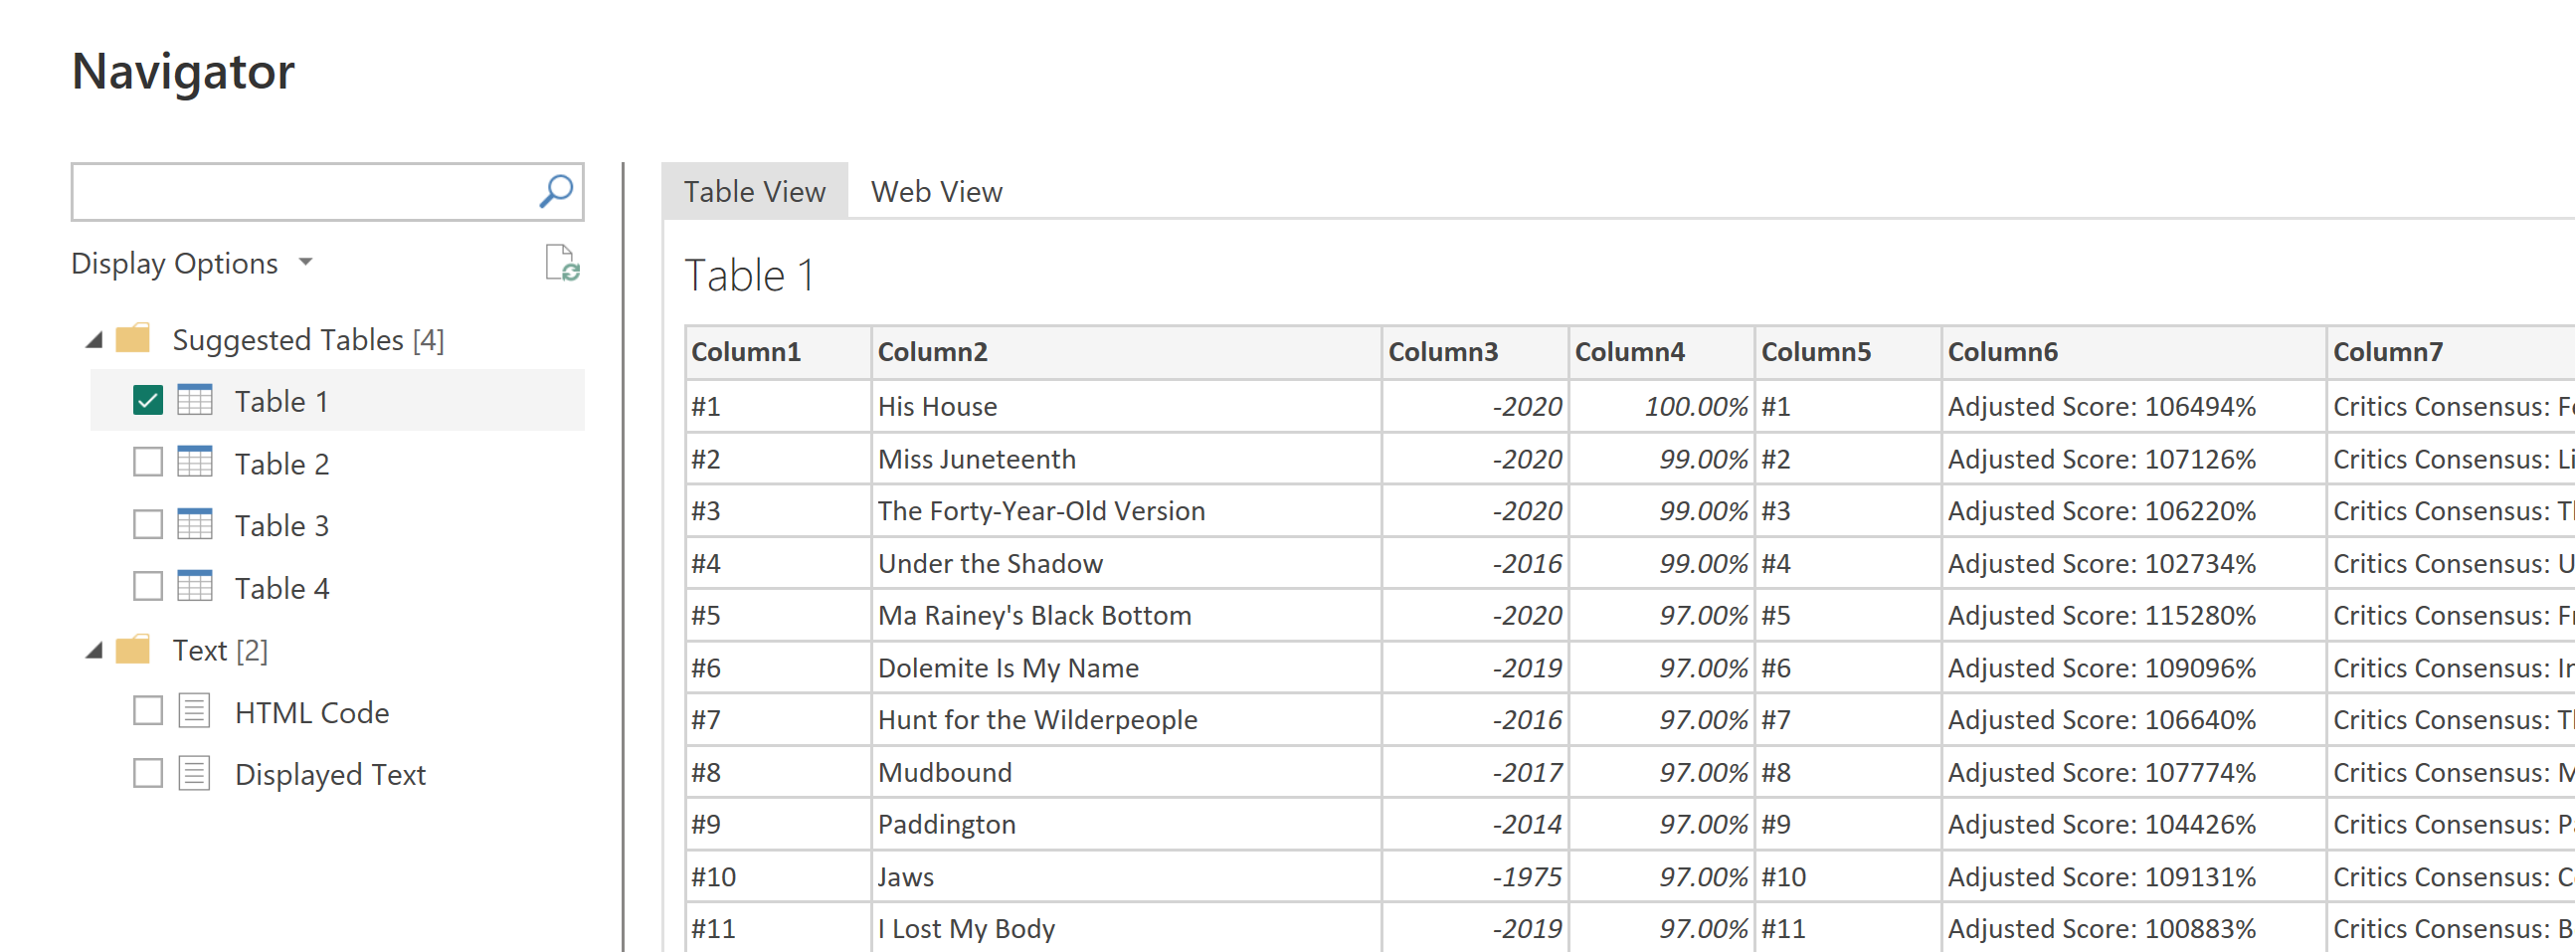
When loading the data into Power BI, a preview will show the generated tables, in my case, all the key information such as the movie name, rank and year it was released, is stored in one table ('table 1'). Whilst I am unable to show all the generated field, even from the extract below, it is clear that the data isn't in an ideal format, there is some repetition of data fields, there are no headers, and the movie rank and year both have special characters in front of the number(s).
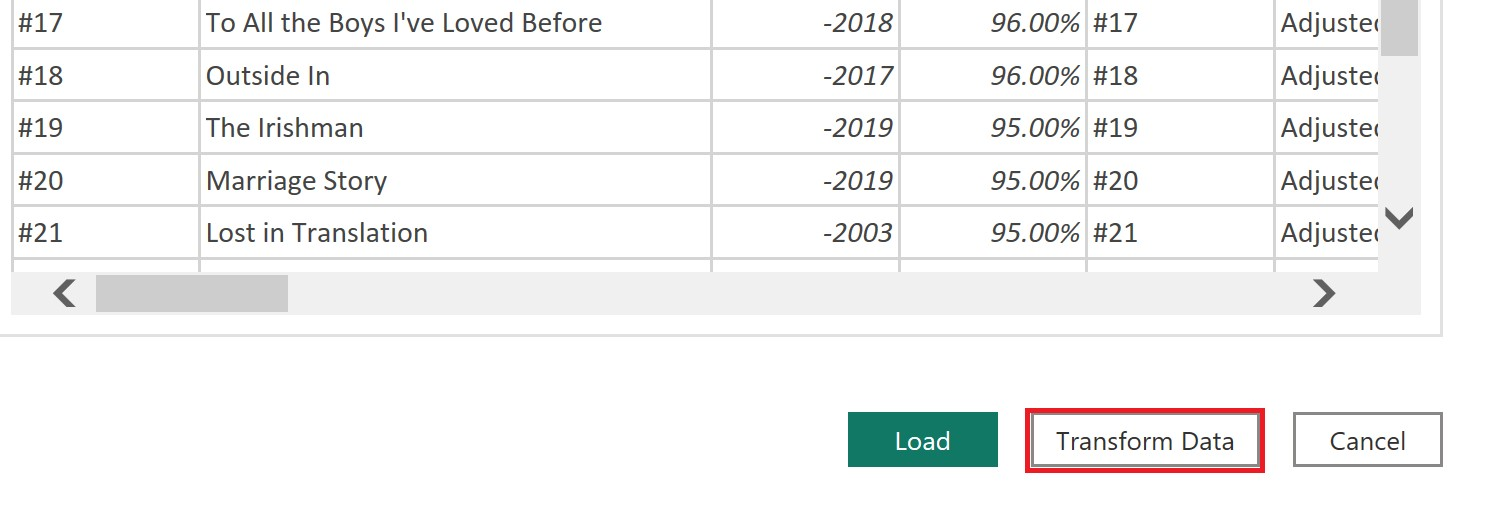
These are all things we can resolve in Power Query. In this case, instead of selecting to load the data, we want to make use of the transform data button.
Once in Power Query, there are simple changes which can be performed by clicking through the available actions, or by just right clicking on the data fields. For example, when looking to delete any unwanted data fields, we can do this by right clicking on the data field and selecting 'remove'.
To remove unwanted characters, we can extract 'text after delimiter', which returns all values after a specified character. For the year data field, our delimiter would be '-'.
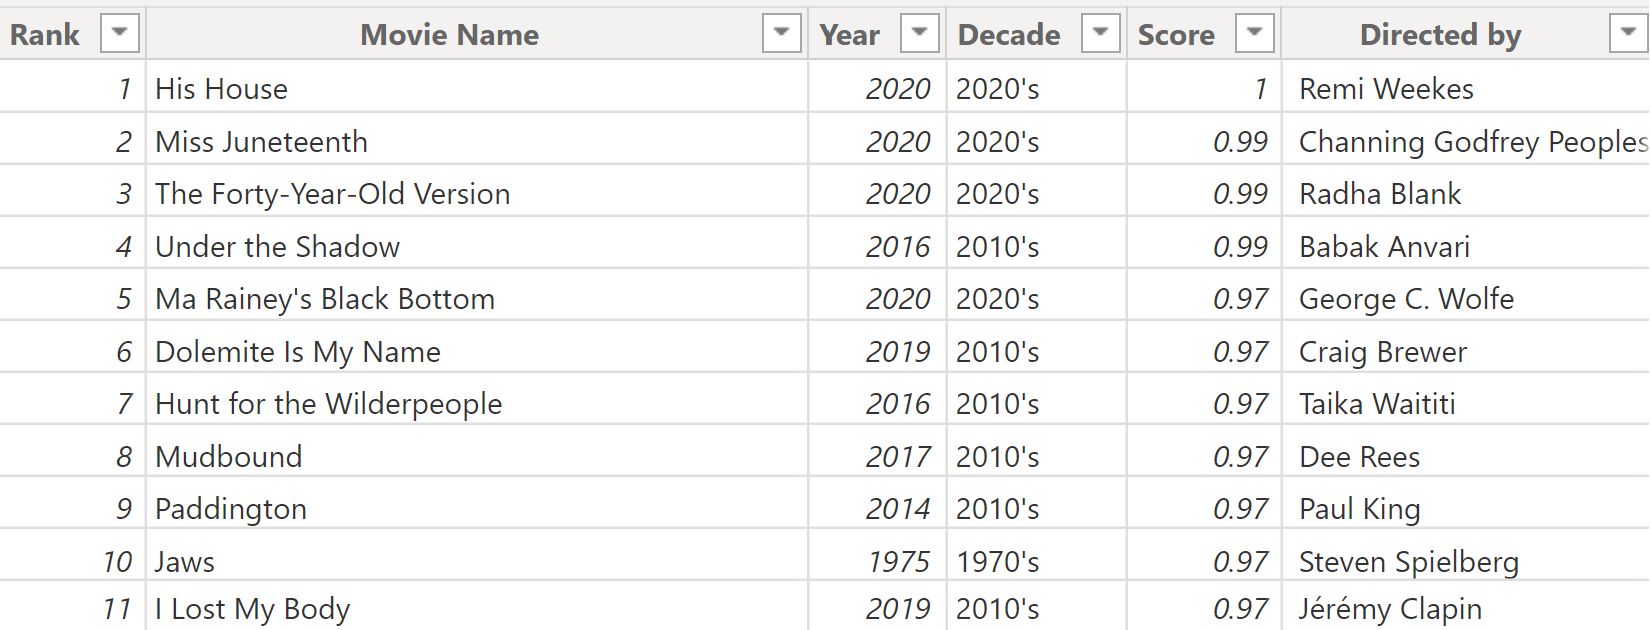
With some basic data cleaning, we can take the above view and make it look like this:
Once our data is clean and ready to be analysed, we can continue the process in Power BI. This allows us to visualise the data in a dashboard format, such as my example below.