


Tableau prep has a number of handy calculations, which can be created in the clean step using a visual calculation editor. This blog will show you how to use the tile calculation through this editor.
The tile calculation assigns your data into a set number of 'buckets'. This can be useful in cases such as when examining sales data to get a better understanding of customers.
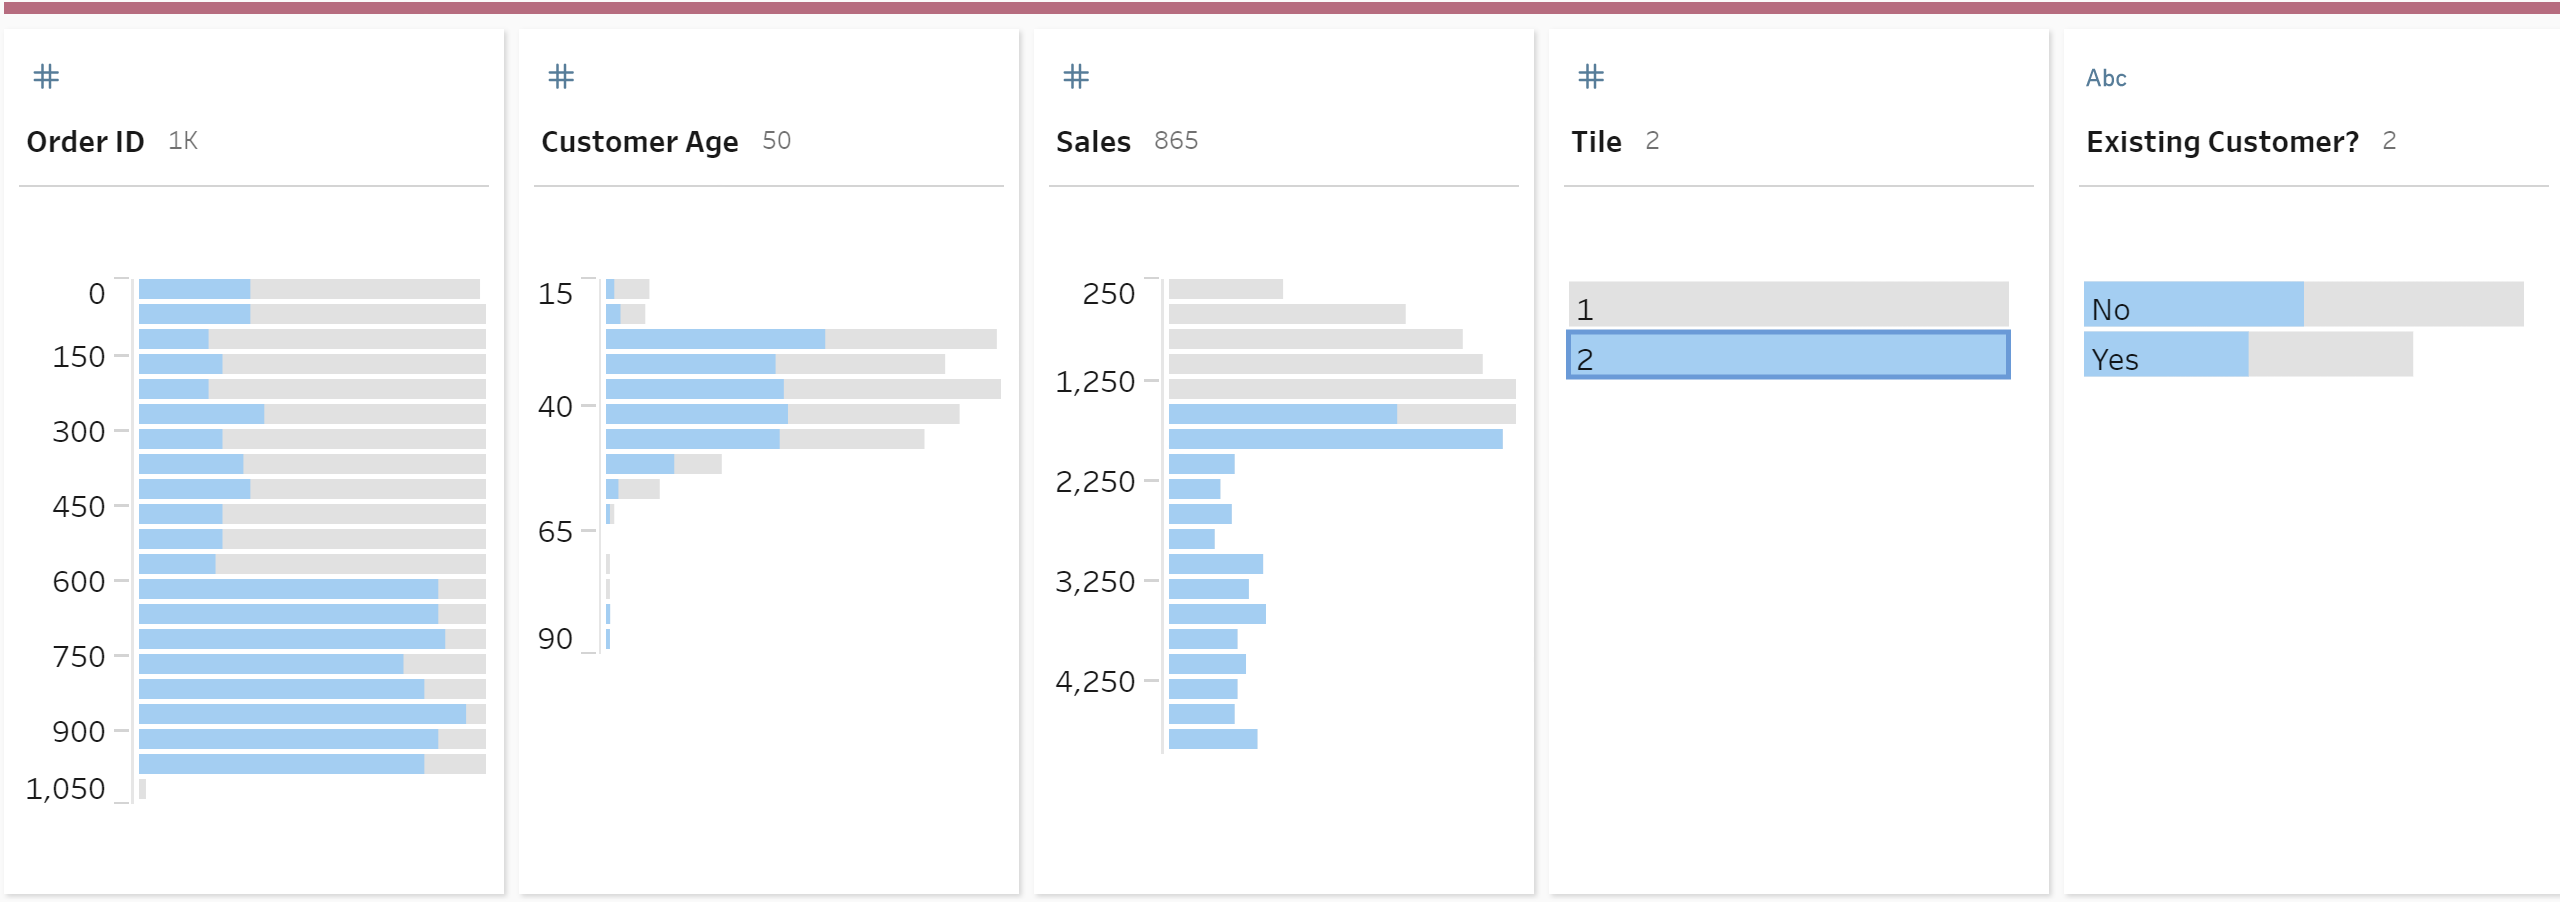
This is an excerpt of the data we will be applying a tile calculation to.
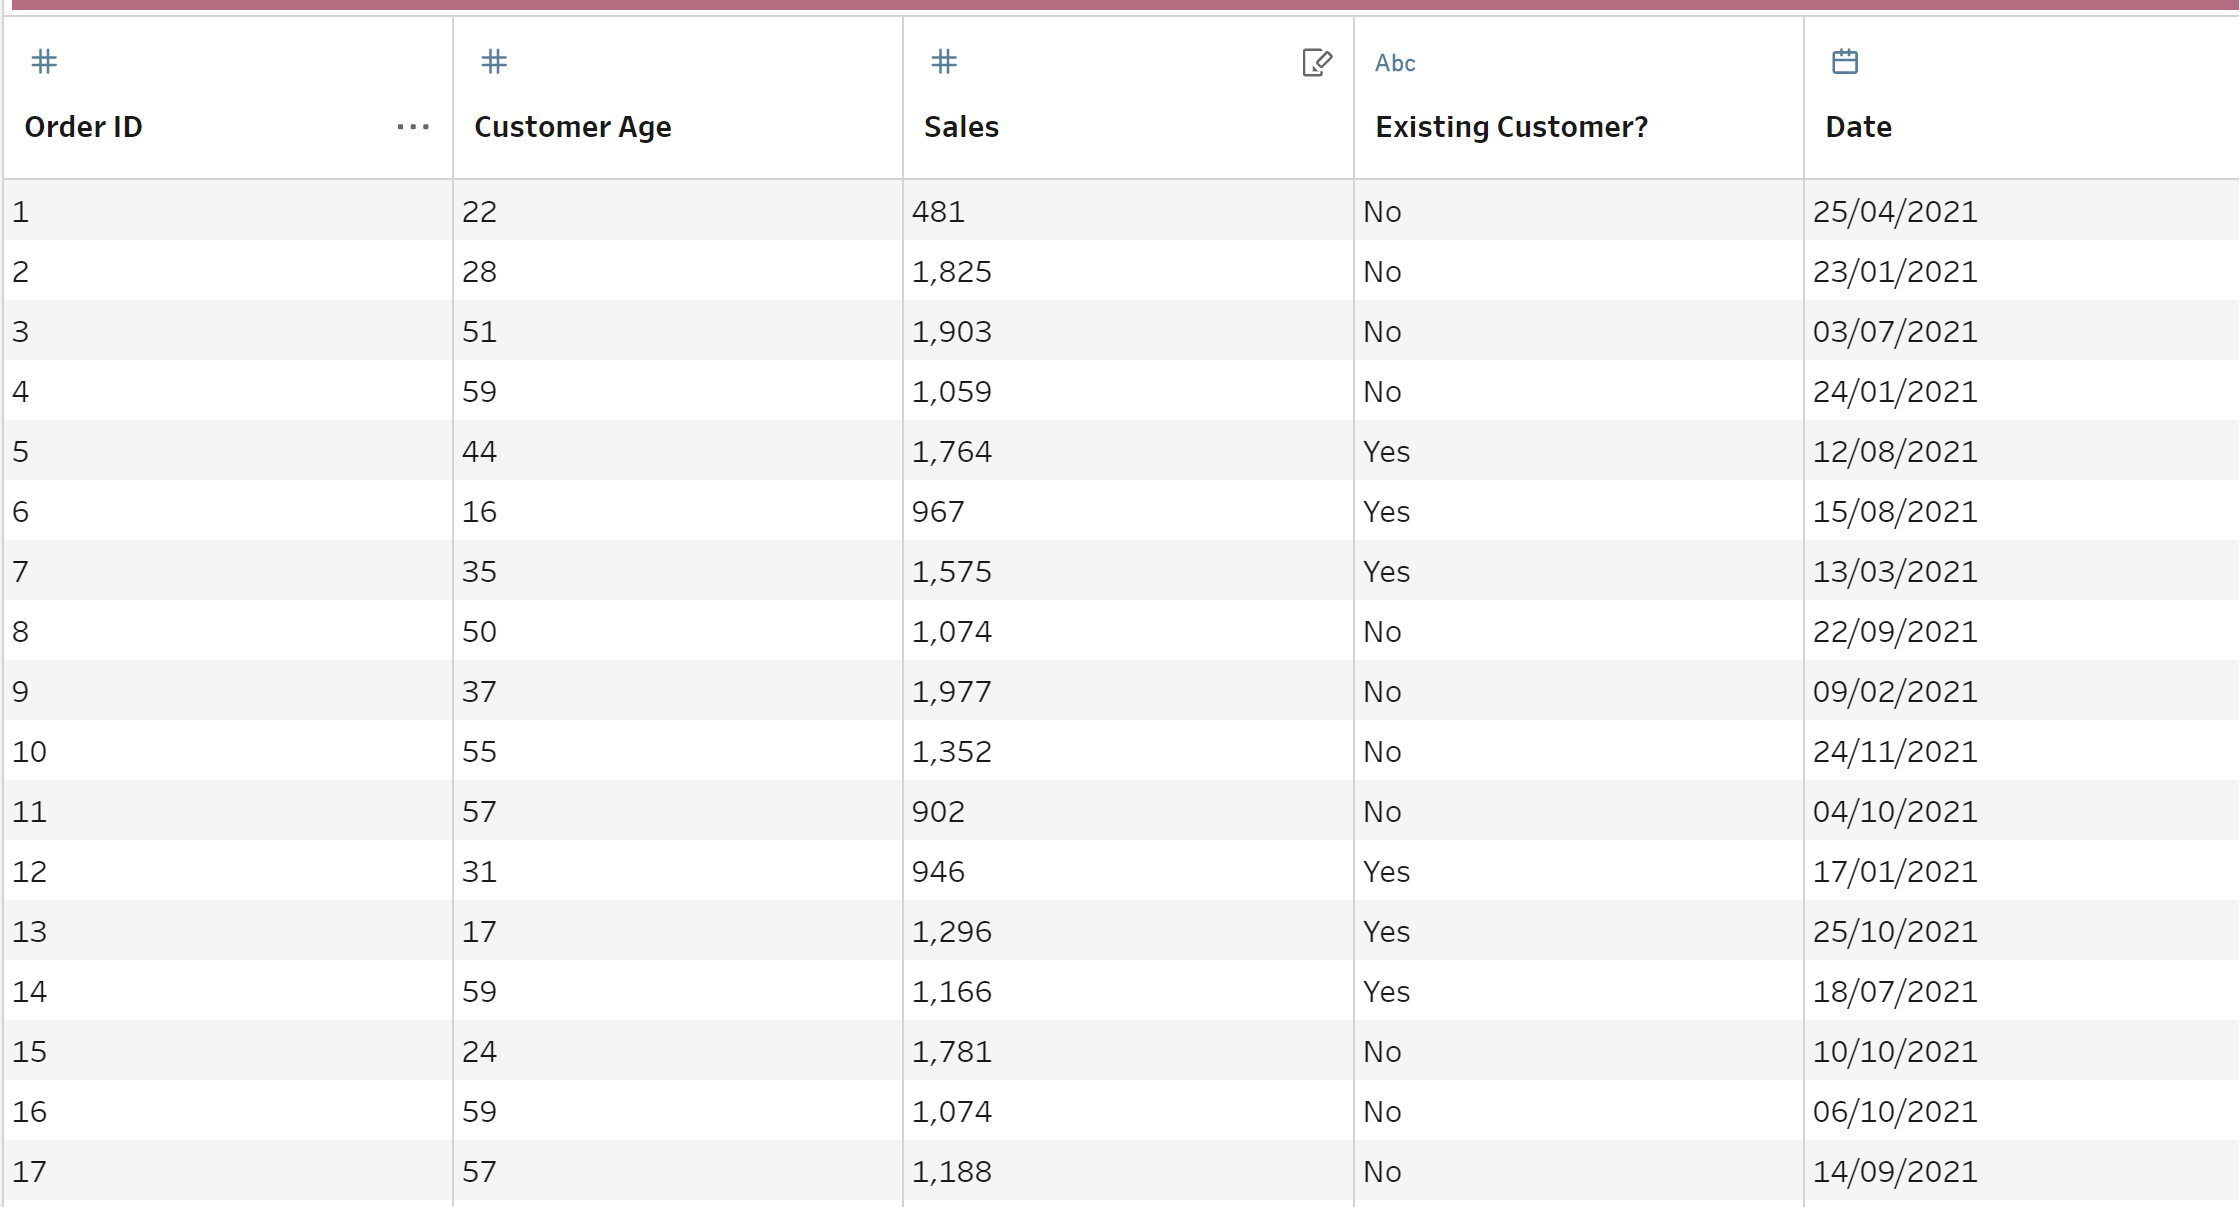
We will be applying the tile calculation to our sales data field.
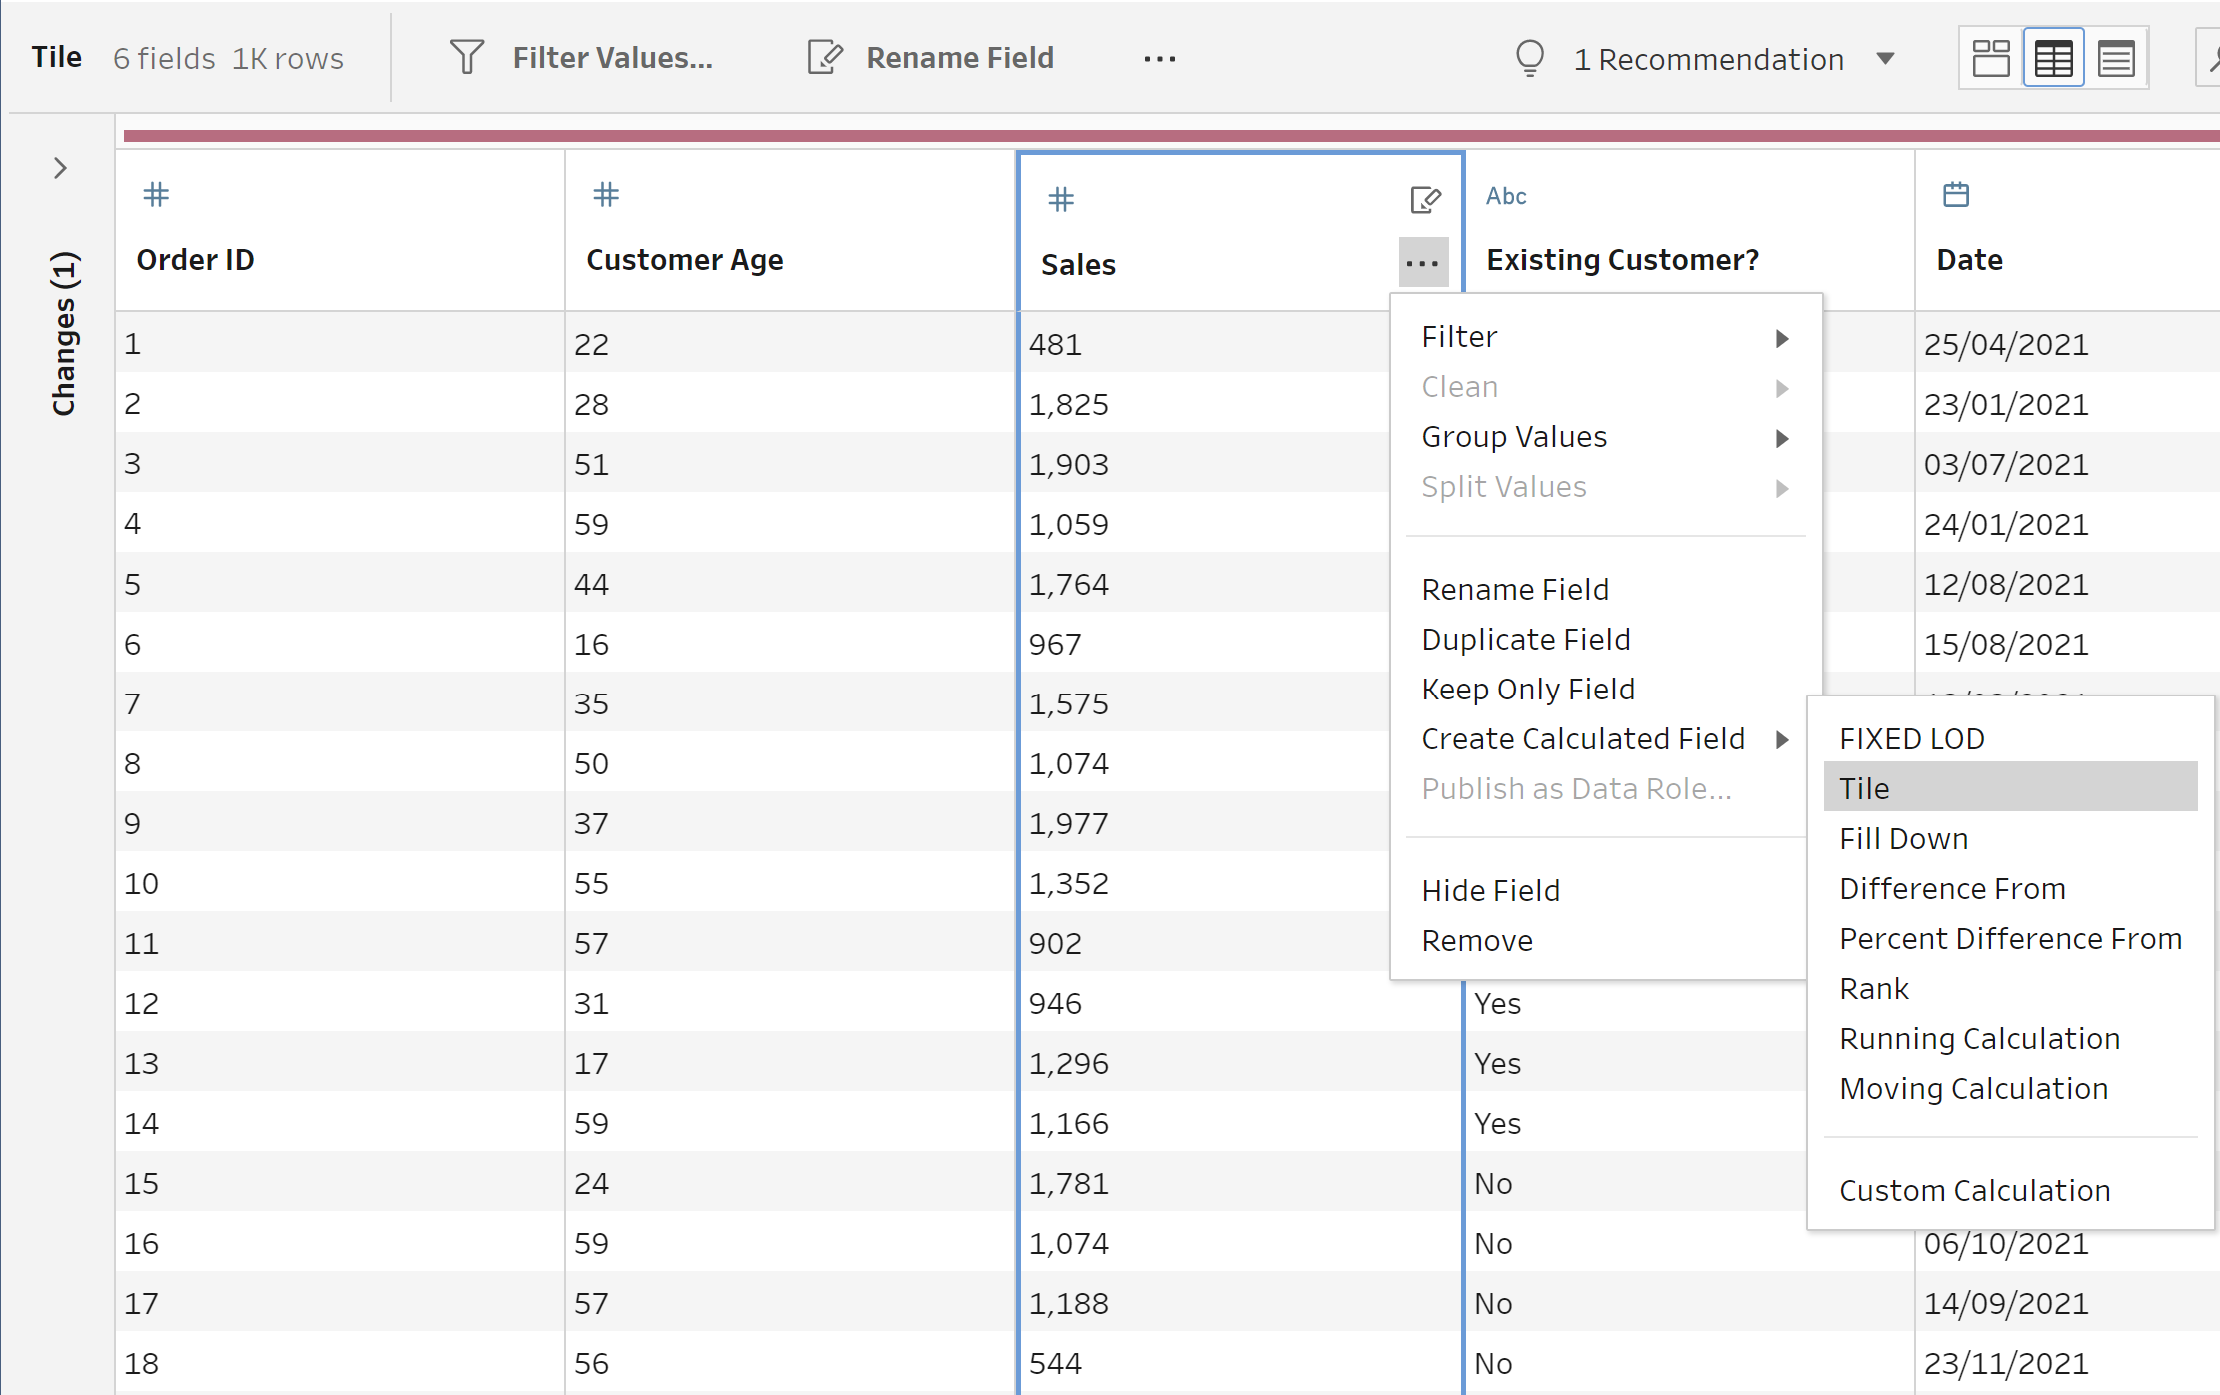
The tile calculation can be found by selecting the three dots on the data field you want to use, within the 'create calculated field' drop down options.
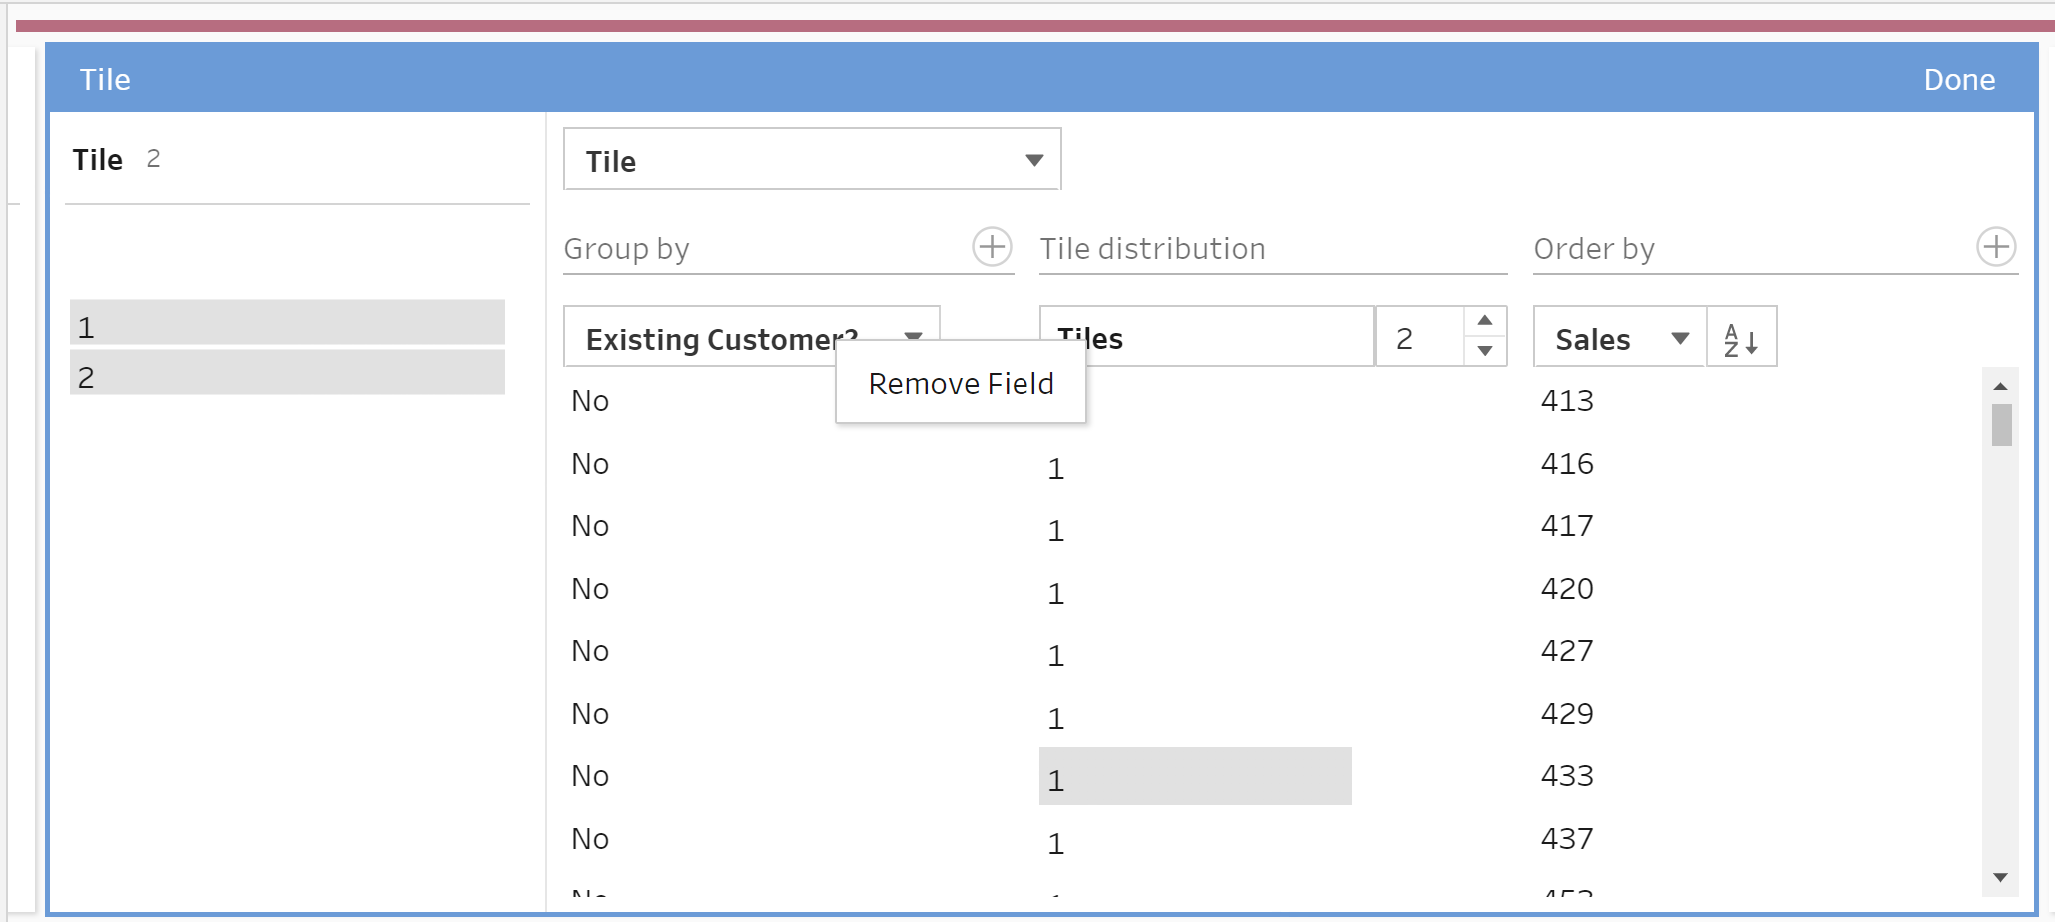
When we select tile, it opens the following editor. This means we don't actually have to write the calculation ourselves. We can configure the calculation through the editor.
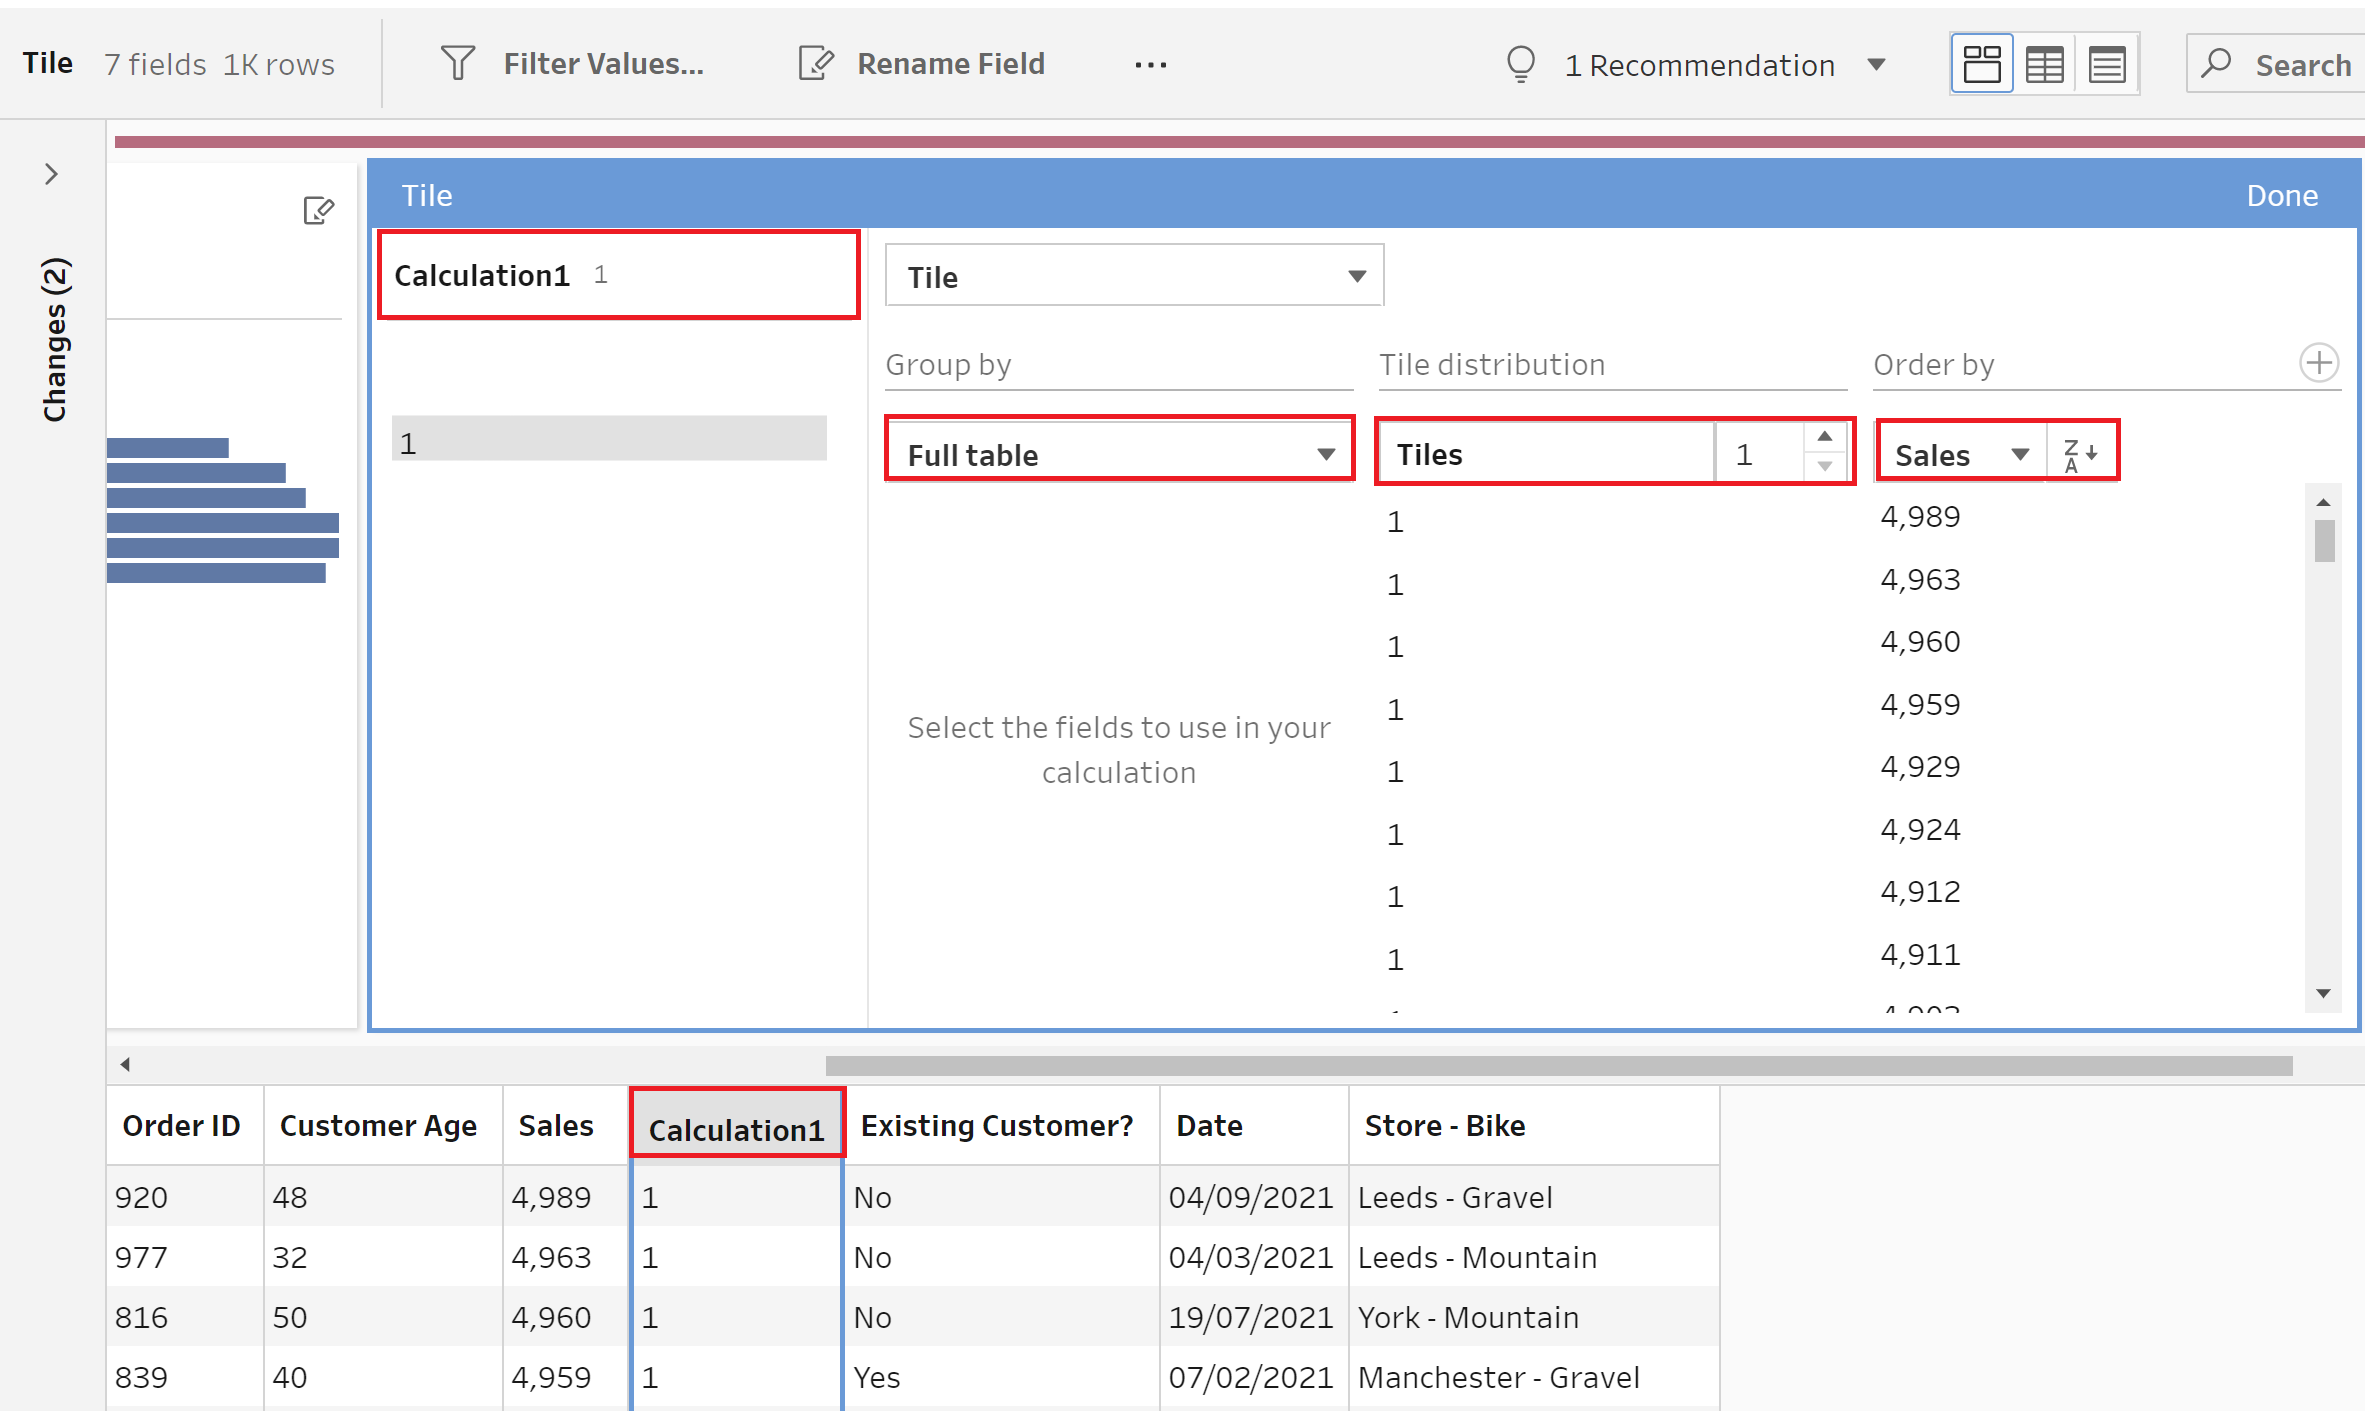
The red boxes highlight the points of interest in this calculation editor and the data pane. Opening the calculation editor created a new data field 'Calculation1'. We can rename this in the calculation editor, in the top left corner by hovering next to the other highlighted 'Calculation1' and selecting three dots that appear.
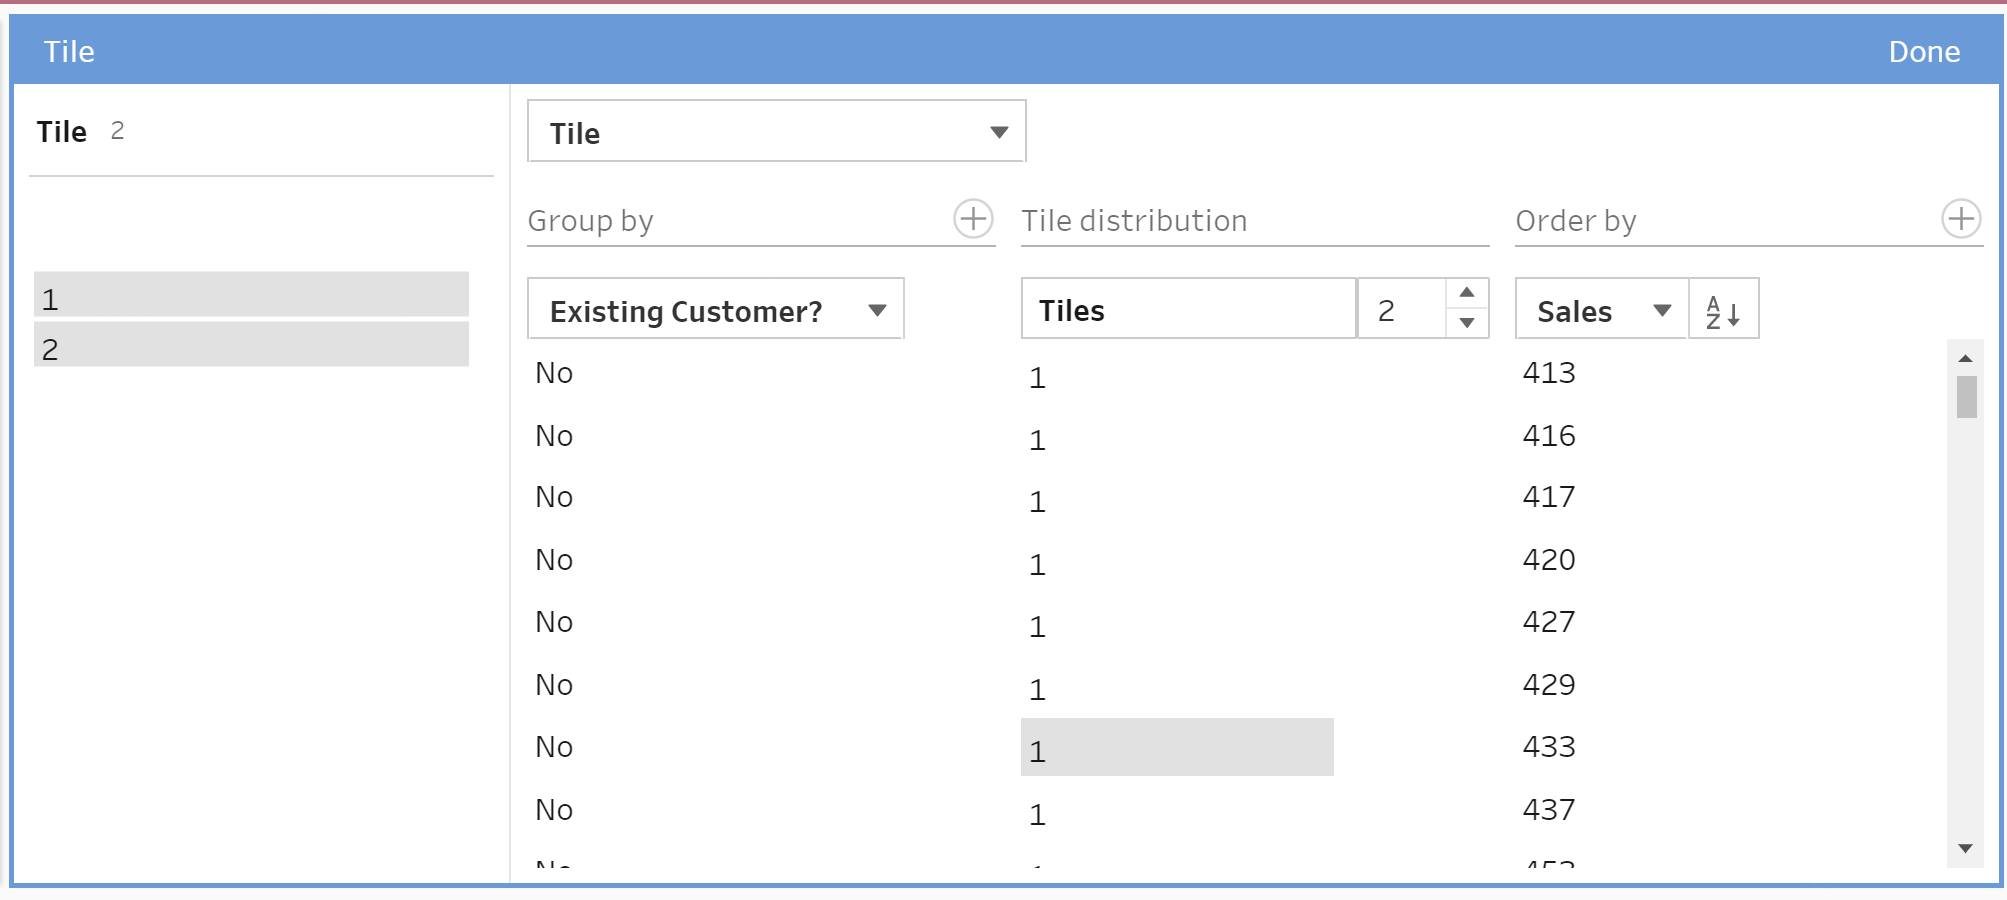
In the editor, we now want to select what we group by for our tile calculation. The default is 'full table' but in our case we are going to change it to 'Existing customer' This means that the calculation will be carried out separately for new customers and existing customers. For the purposes of the example, we will increase the number of tiles from 1 to 2. Leaving it at the default number of '1' would mean that the data isn't actually being partitioned in any way. Having two tiles means that we have 50% of our sales data in tile 1 and 50% in tile 2. We also want to change the order from descending to ascending, so it goes from smallest value sales to highest value sales.
Having selected all the options as described, we click done. As we have grouped by existing customers, our tile allocation split is as follows: Bottom 50% of sales for existing customers, Top 50% for existing customer, bottom 50% for new customers and top 50% for new customers.
Now we can see in our distribution view, we can use our groupings to get further insights from our data.
If we want to make changes to our calculation we could do so by simply editing our previous step.
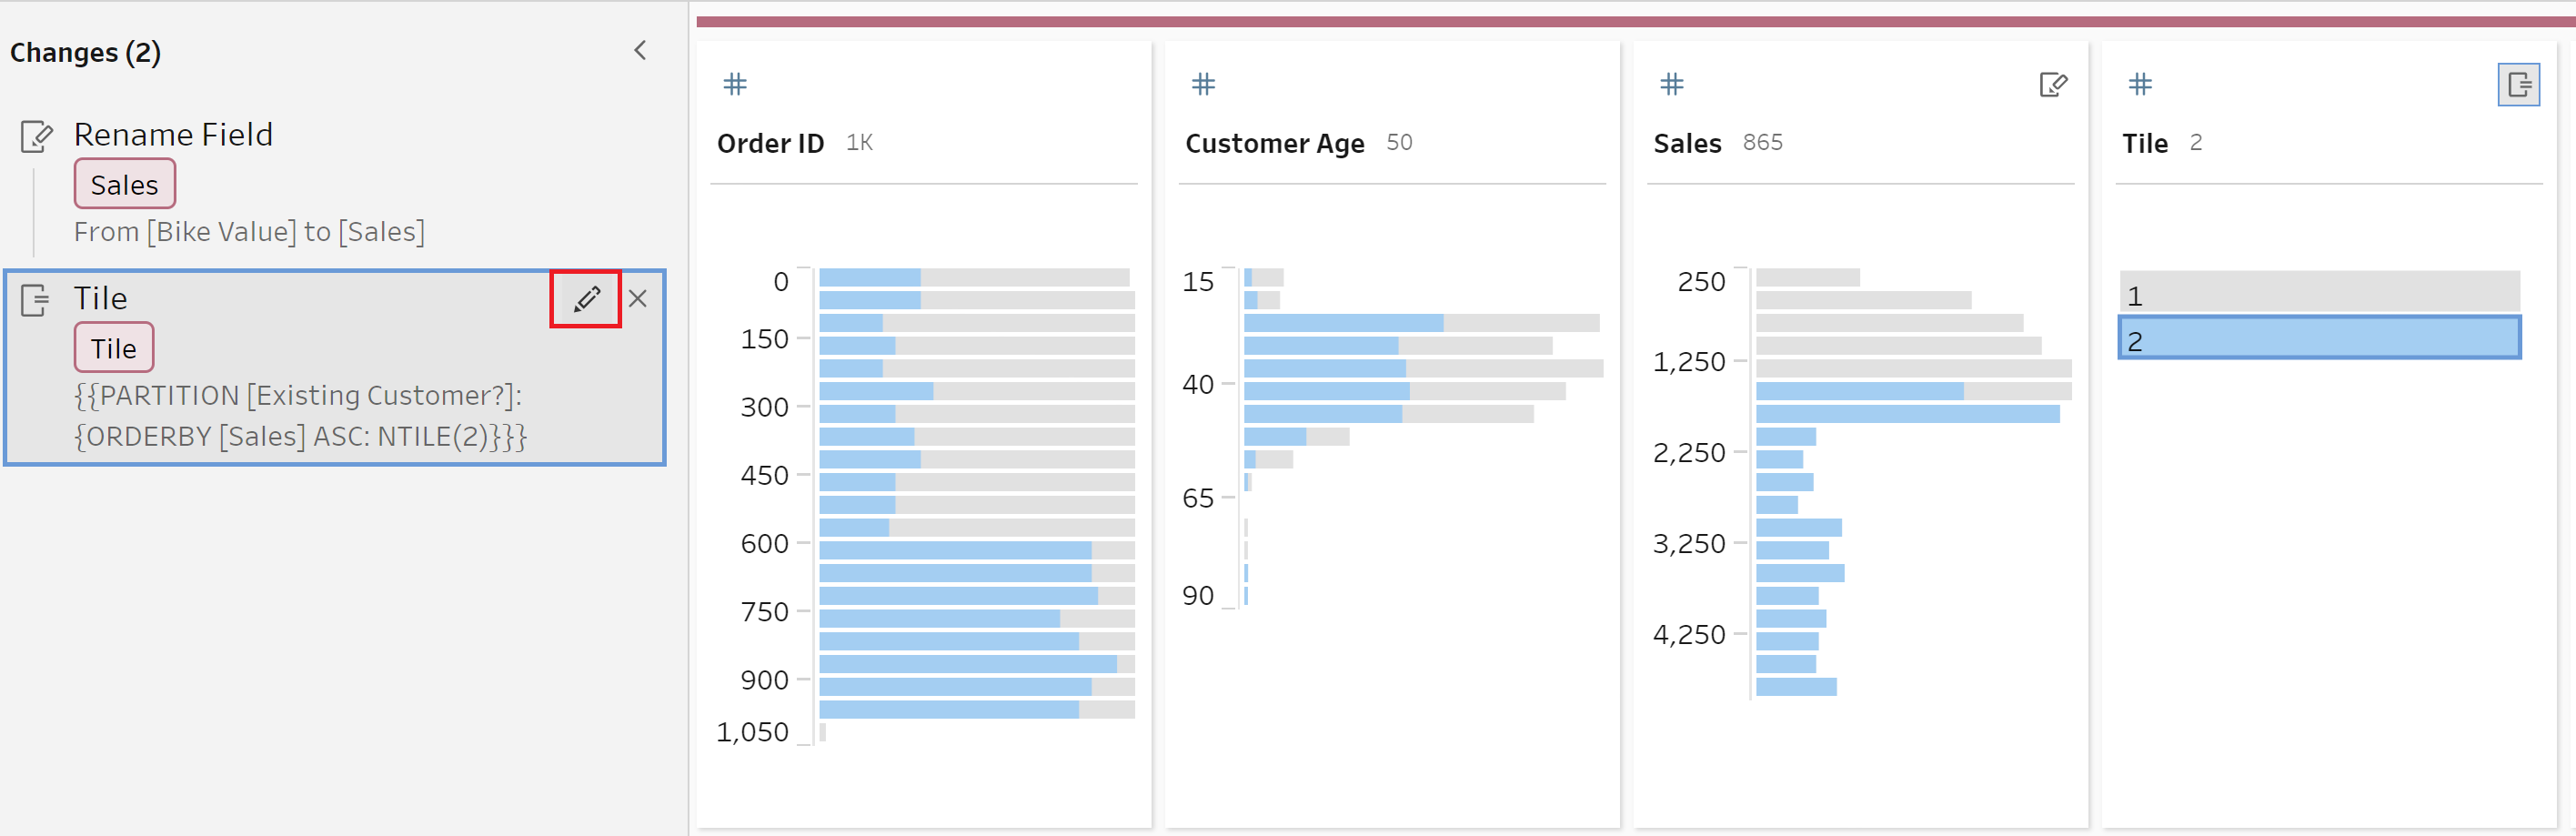
This will return the same editor as previously shown where the calculation can be reconfigured. To remove any groupings you simply right-click and select 'remove field. This would allow us to change our tiles to no longer split existing customers and new customers.
After making any changes, simply close the window by selecting done and review your data.