


Day three is here and we're already mid-way through dashboard week. As expected (due to many sneaky hints) today is SQL day. We've been tasked with preparing data for analysis using SQL queries before connecting to it in Tableau. This means that any aggregations or joins we may need to do will need to be carried out in SQL.
Plan for today

How well did this go?
The first couple of hours went according to plan. I reviewed the data guide and examined some of the key columns and tables. I then sketched out a plan of how I needed my data to look and what question I wanted to answer.
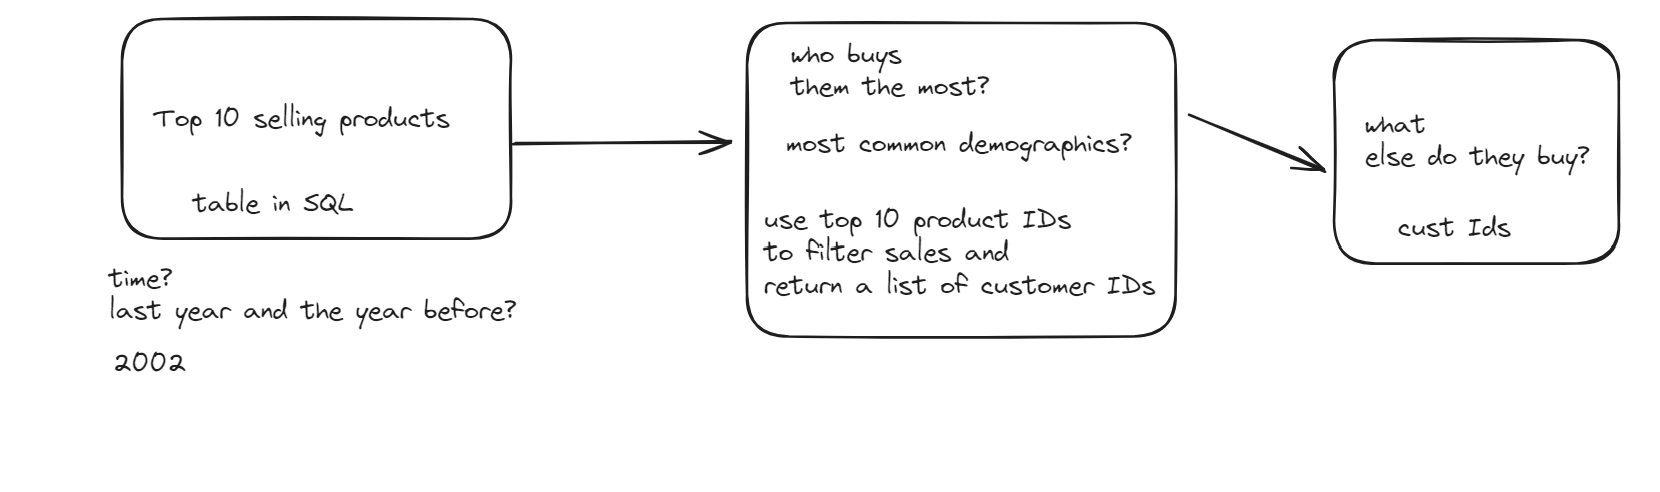
The question I wanted to interrogate was:
- What were the products with the highest total revenue in 2002?
- Who were the customers that purchased these 10 products?
- What else are they purchasing?
The first section of planning and beginning to run queries worked relatively well, however, as my queries became larger, our snowflake server struggled to run and return the queries in a short amount of time. Additionally, as there are 8 of us working on the same dashboard week task, our requests were all impacting the server and slowing it down. This has meant that by 12:30, I was nowhere near done with my SQL queries.
This meant that I had to narrow my scope and focus on getting the SQL queries that were working into Tableau, rather than trying to gather additional information.
I found working on a CTE to find my top 10 products which I could then use within another query to then pull the customer information of all customers who bought these top 10 products.
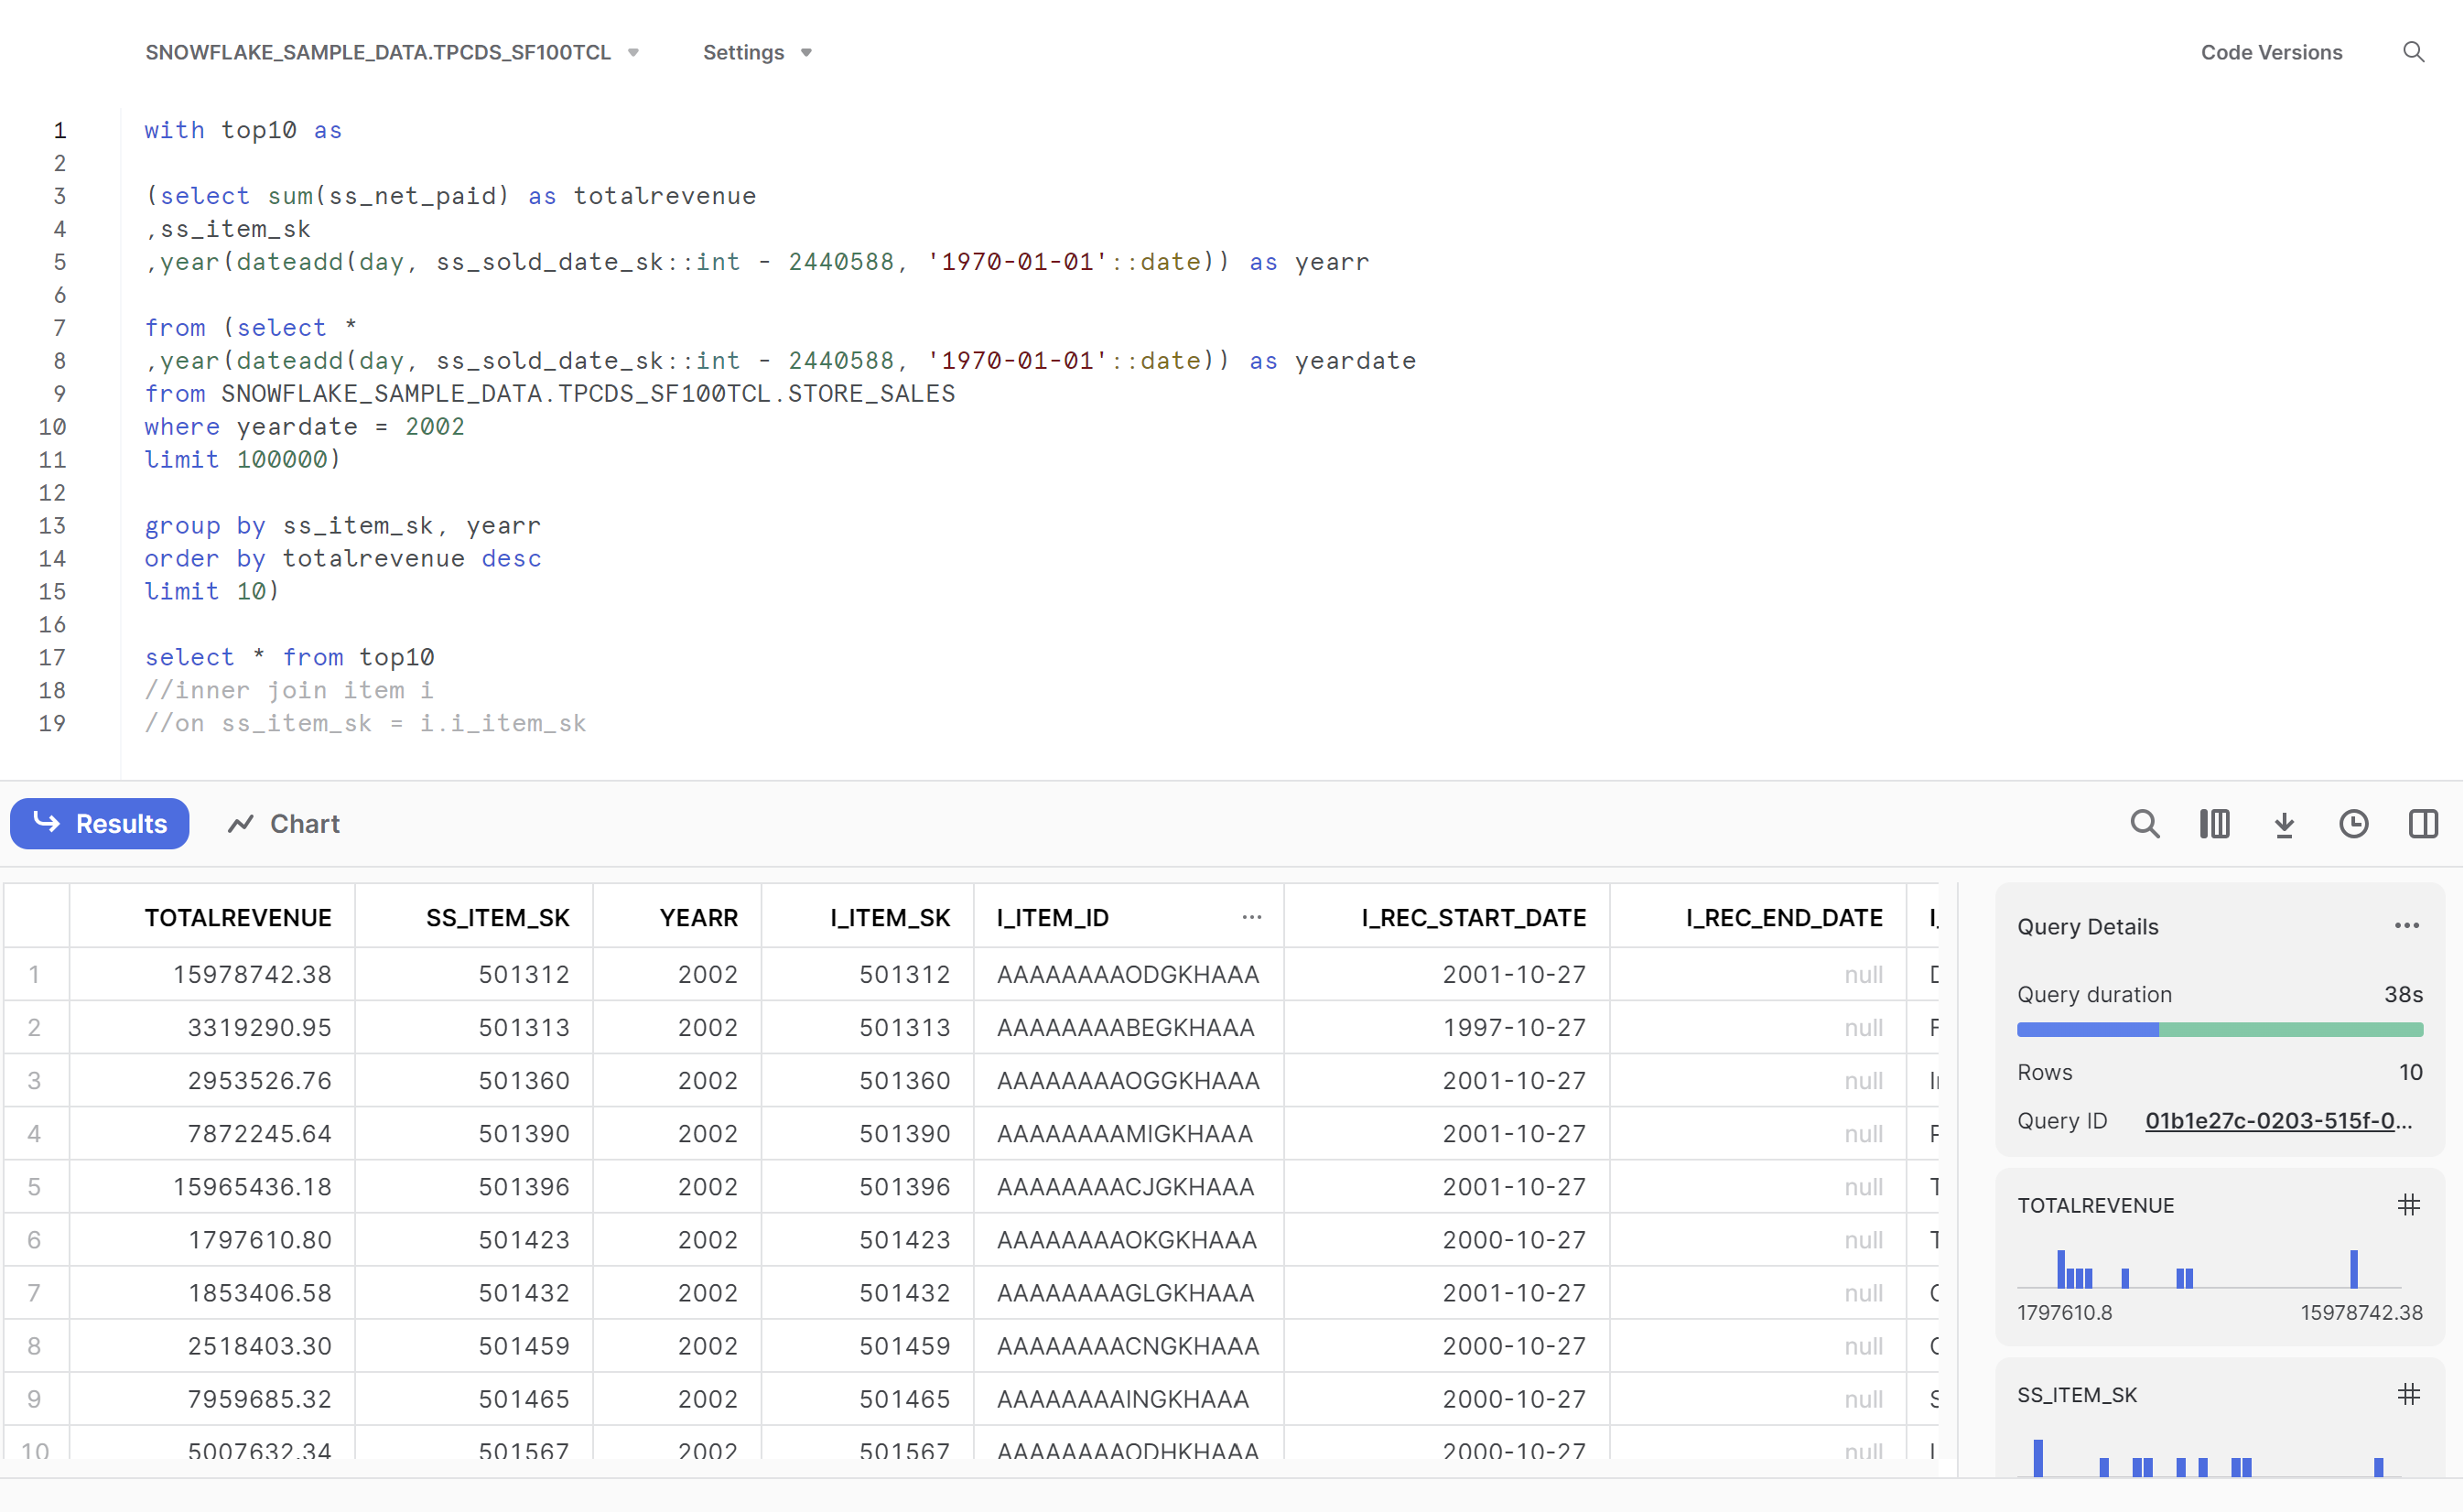
By 14:00, I had entered and ran two SQL queries in Tableau. One which returns my top 10 products in 2022, with their total revenue, and one which returns all customers who purchased these top 10 products in 2022, and their demographics. However, my next hurdle was creating an extract in Tableau which held enough data and also allowed Tableau to run without crashing.
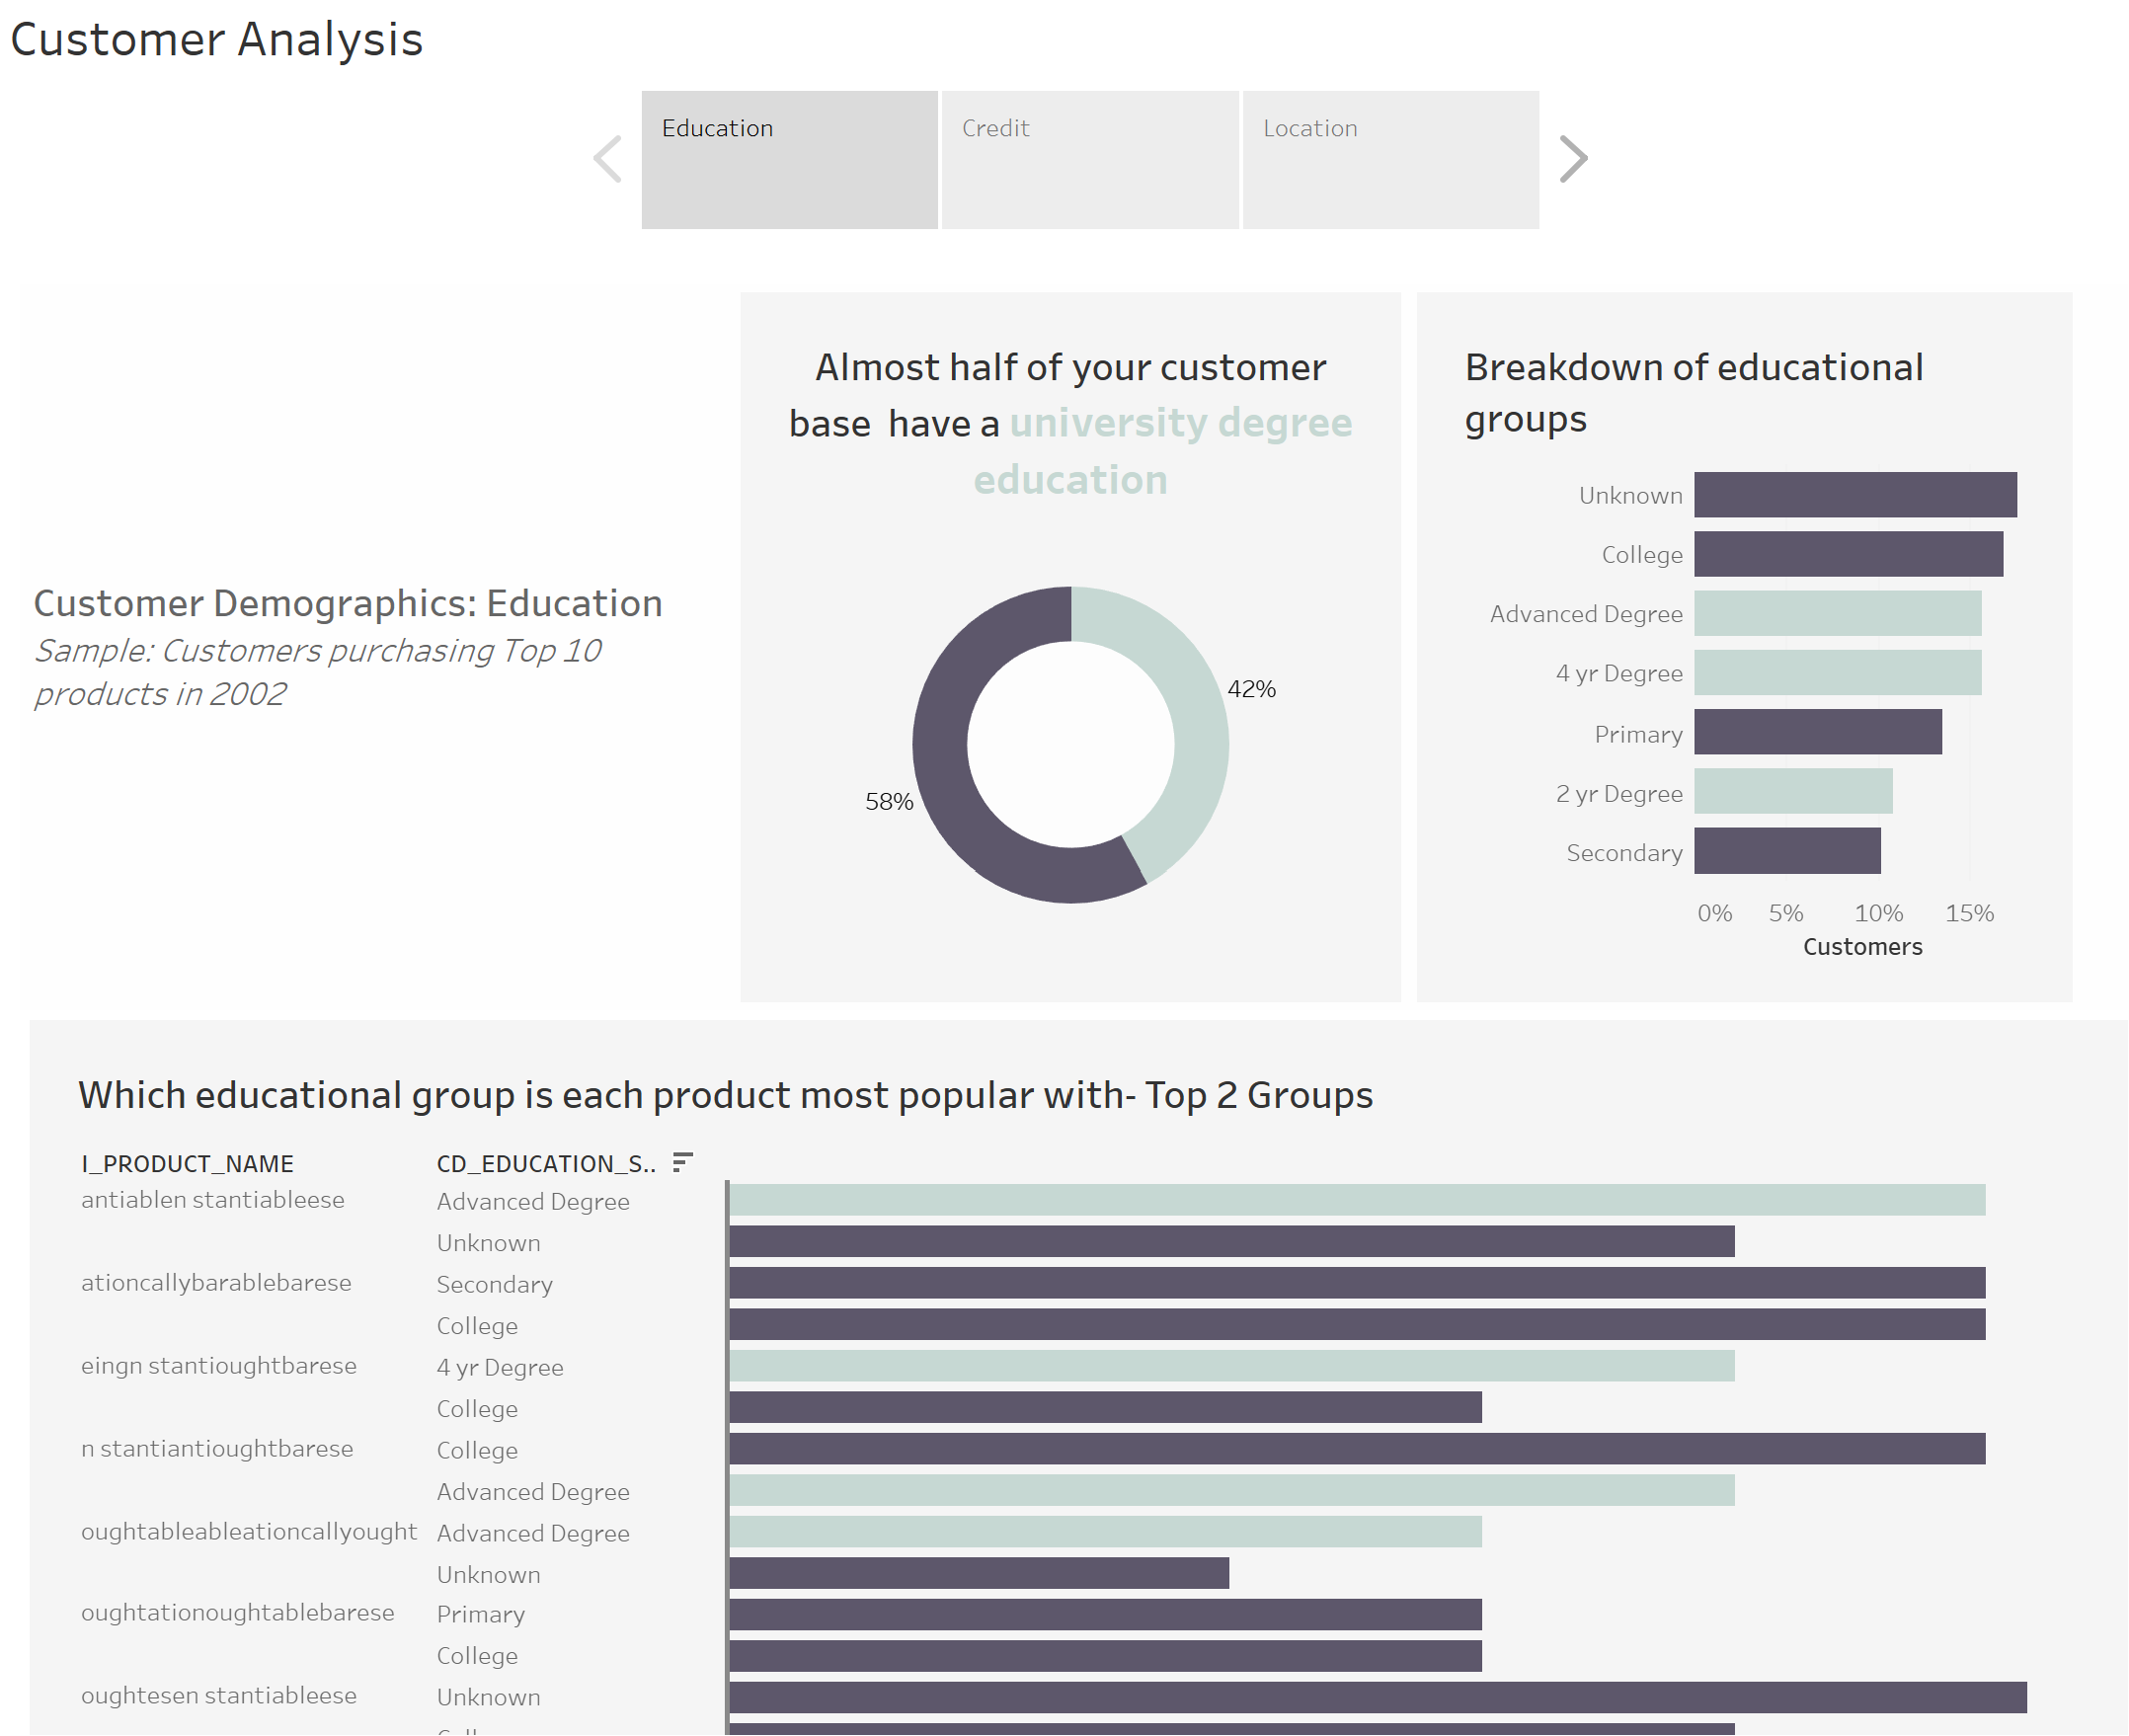
The aim of the task was to produce some output in 'story' format in Tableau based on our question of analysis. My output was based on a limited sample due to the issues extracting the data in Tableau, but this is a sample of the quick dash analysis I was able to do within the time constraints
Reflections
Working with SQL was really interesting but frustrating at times, especially given the gigantic size of the database. Perhaps the most frustrating learning experience was trying to limit rows whilst aggregating, as the limit function happens last and so a query still take a very long time to load, hence why I actually included a sub-query within my top 10 product CTE to limit the rows first, then aggregate, and then sort and limit again. However, this meant that I wasn't working with a 'true' top 10.
Surprisingly, we're over half way done so bring on Day 4.