Using the Sample Superstore dataset, I'm going to explain how to create a Top N slider of subcategories using parameters. If you've ever wanted to visualize the top performers or highest sales, but give the user control over N, this is the perfect technique for you.
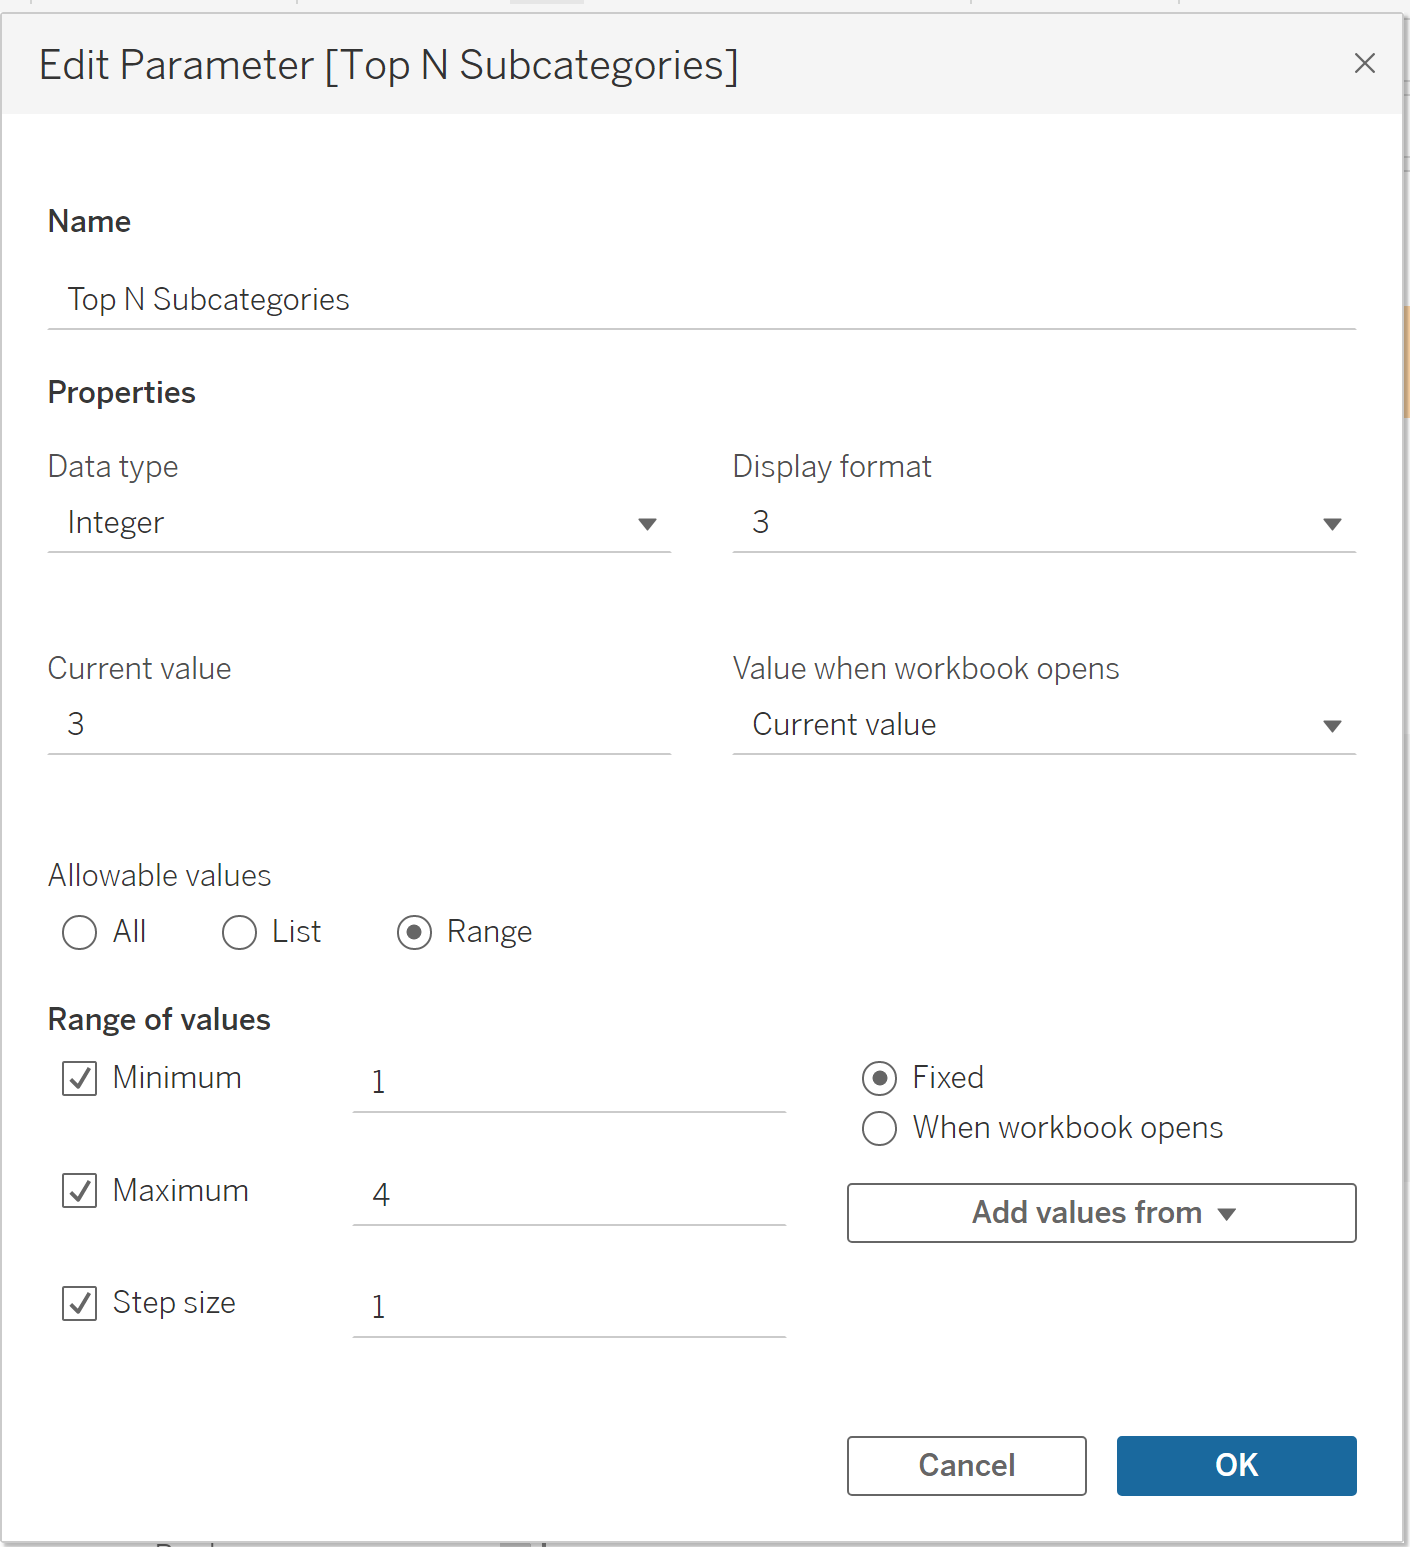
Firstly, we need to set up a parameter in Tableau. To create a parameter for our Top N slider, go to the Data pane, right-click, and select Create Parameter. Give it a meaningful name, such as "Top N Subcategories," and set the data type as an integer and select range. I want the user to be able to view up to 4 subcategories at a time, so I'll set the minimum to 1 and maximum to 4.
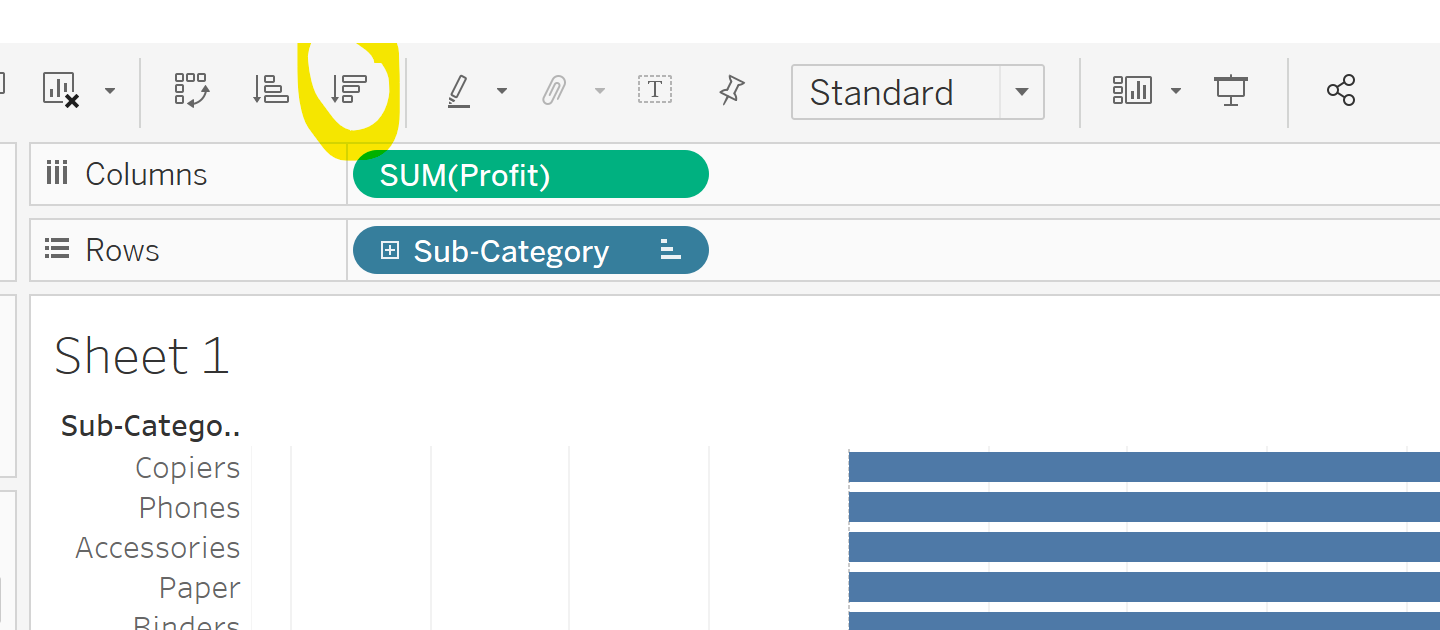
Next, drag subcategories into the rows shelf and your metric (I'll be using profit) into the columns shelf. Click the button above the columns shelf to sort subcategories by profit.
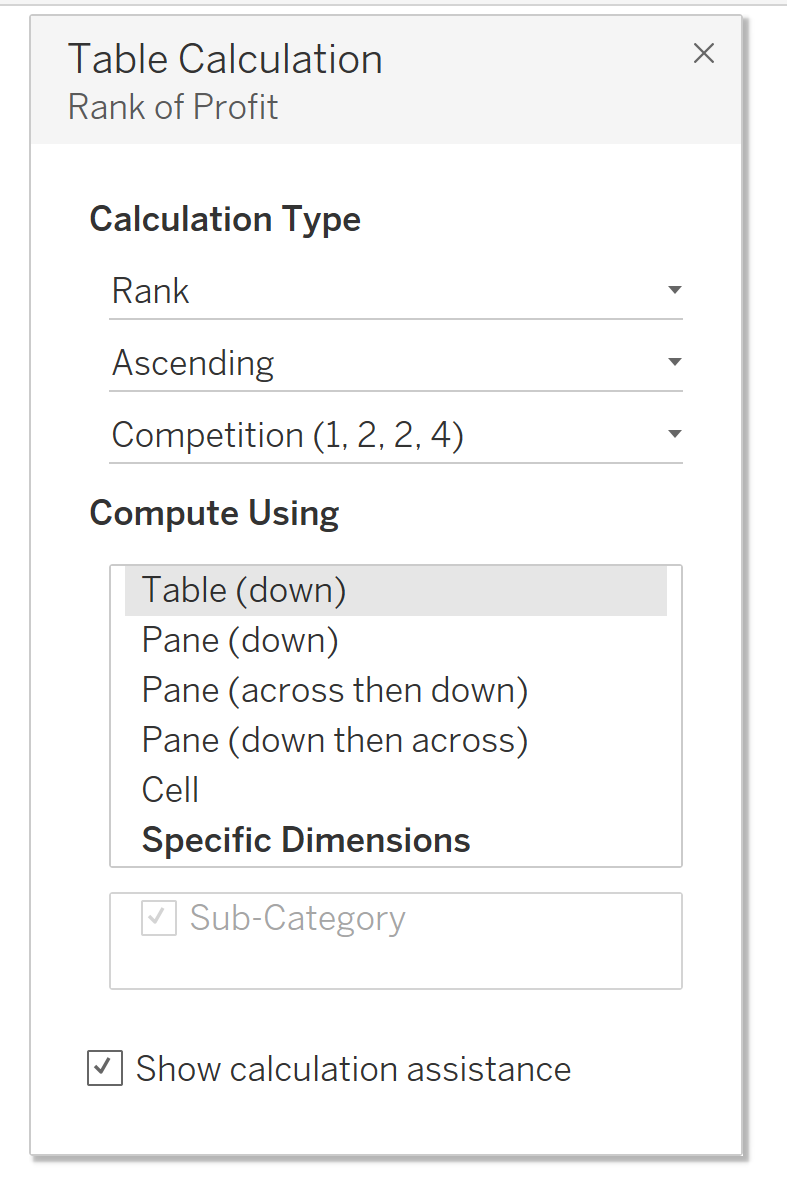
Drag your metric in again onto the rows shelf, click the dropdown arrow and select add table calculation. In the calculation type, select rank, descending and table down.
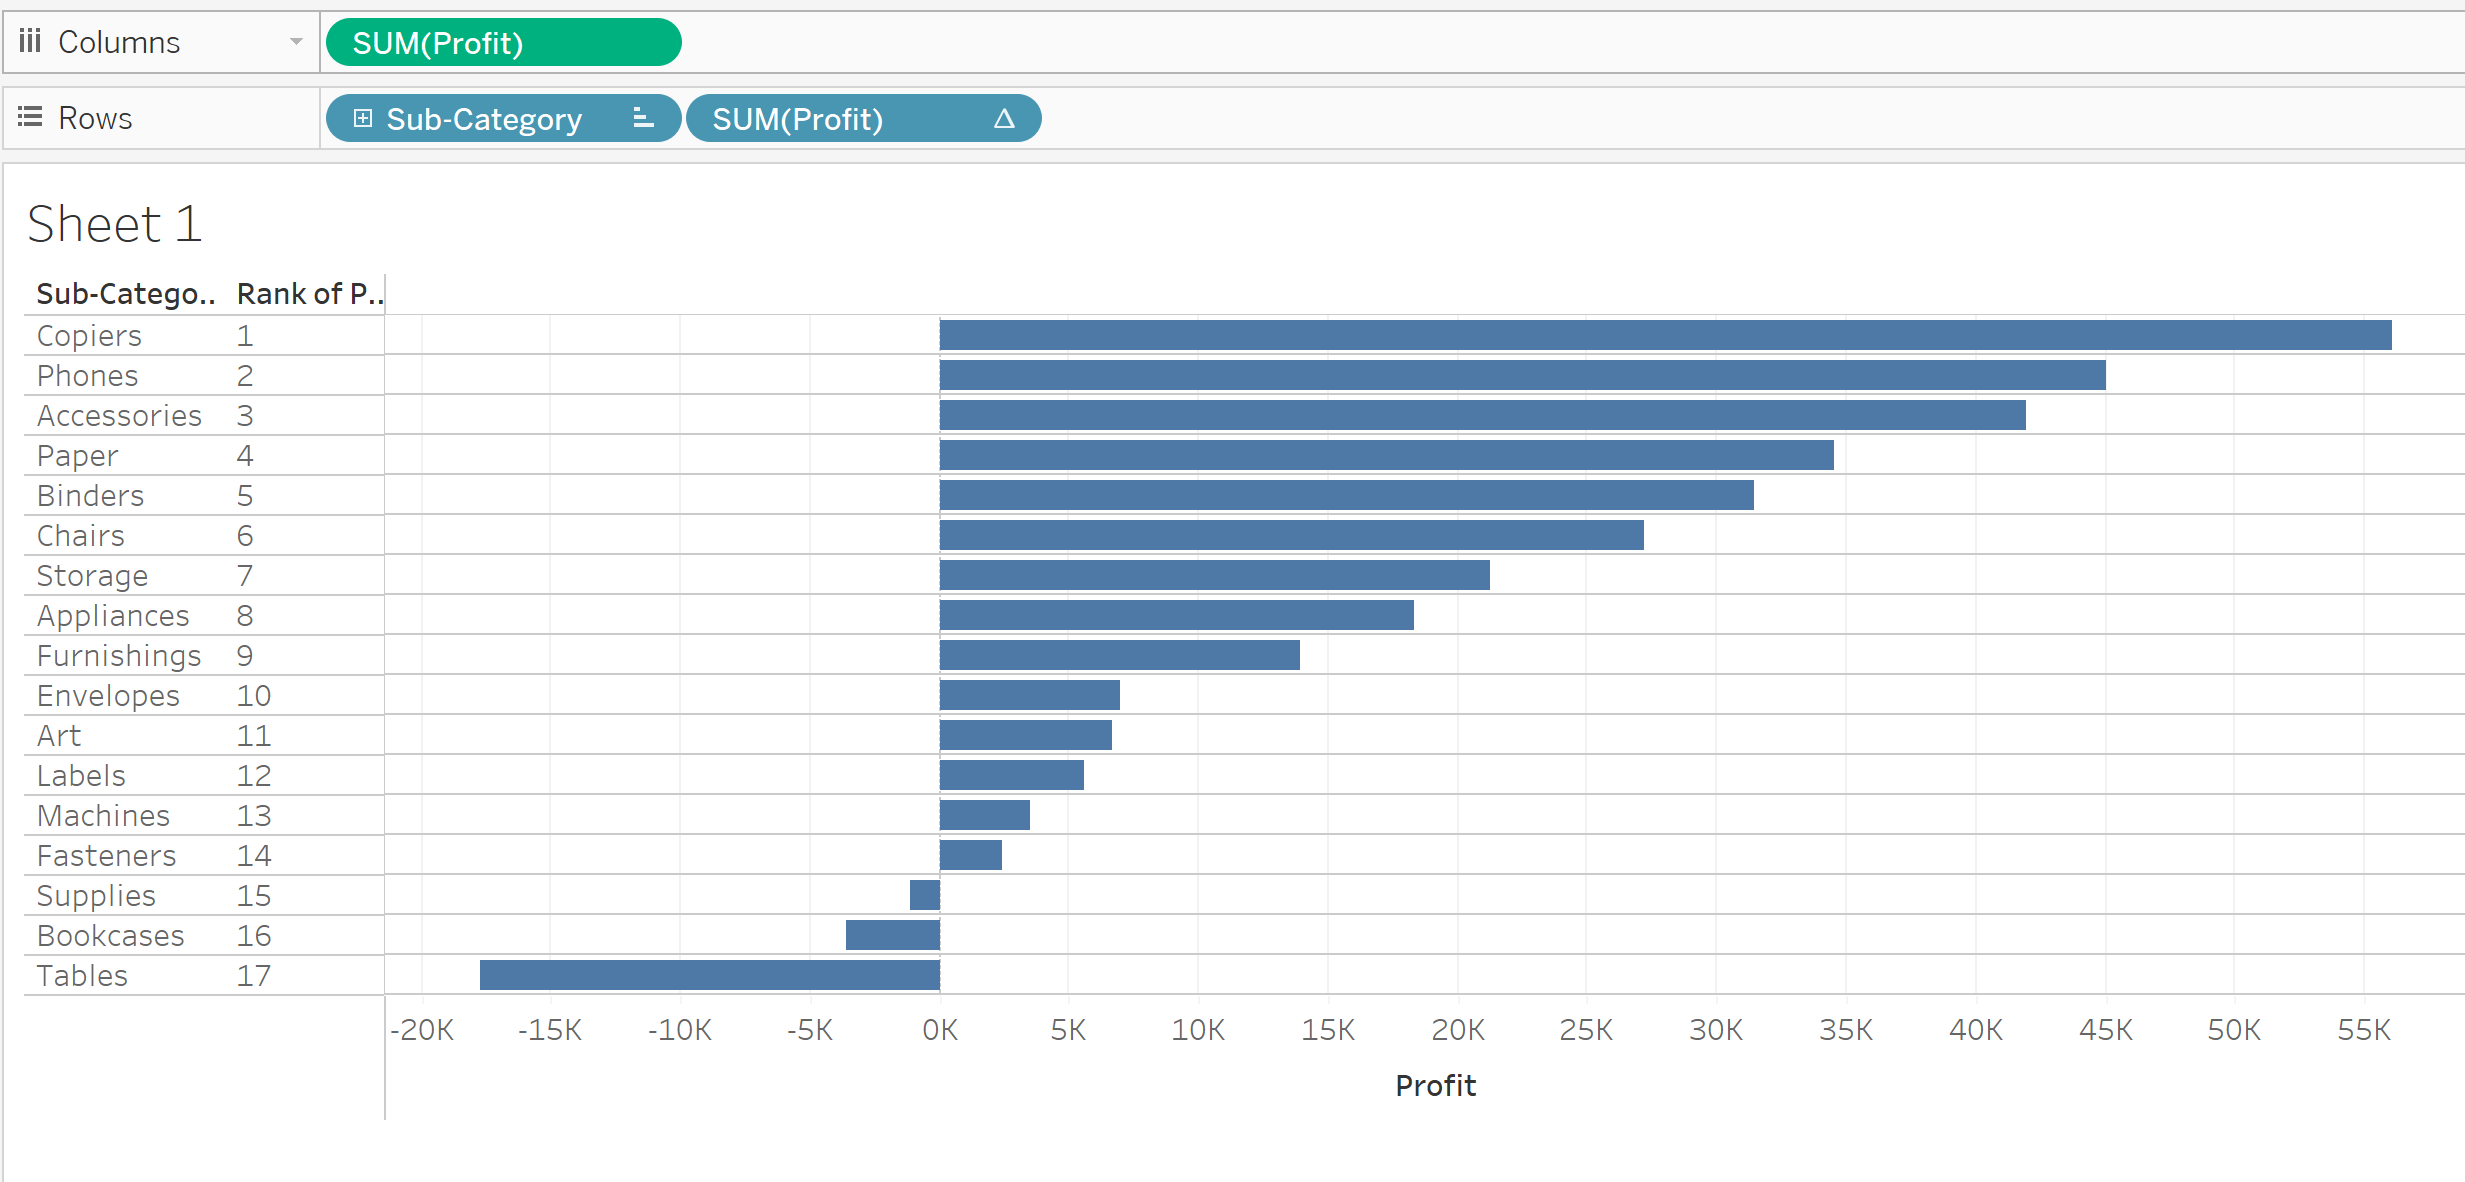
Change this field to discrete. You should now have a view that looks like this.
Now we need to create a calculated field that decides whether or not the subcategory is in the top N.
Top N Filter:
RANK(SUM([Profit])) <= [Top N Subcategories]
TIP: drag the profit field in the Rows shelf directly into the calculated field to avoid having to type it all out.
Drag the "Rank" calculated field onto the Filters shelf. In the filter dialog, select "True" to keep only the ranks that are within the Top N range. Click OK to apply the filter.
To make the parameter control visible to the user, right-click on the parameter in the "Data" pane and select "Show Parameter Control." This will display a slider that allows users to dynamically adjust the value of N and see the corresponding changes in the visualization.
Now we can hide the Rank header, gridlines and row/column dividers, set to entire view and voila!
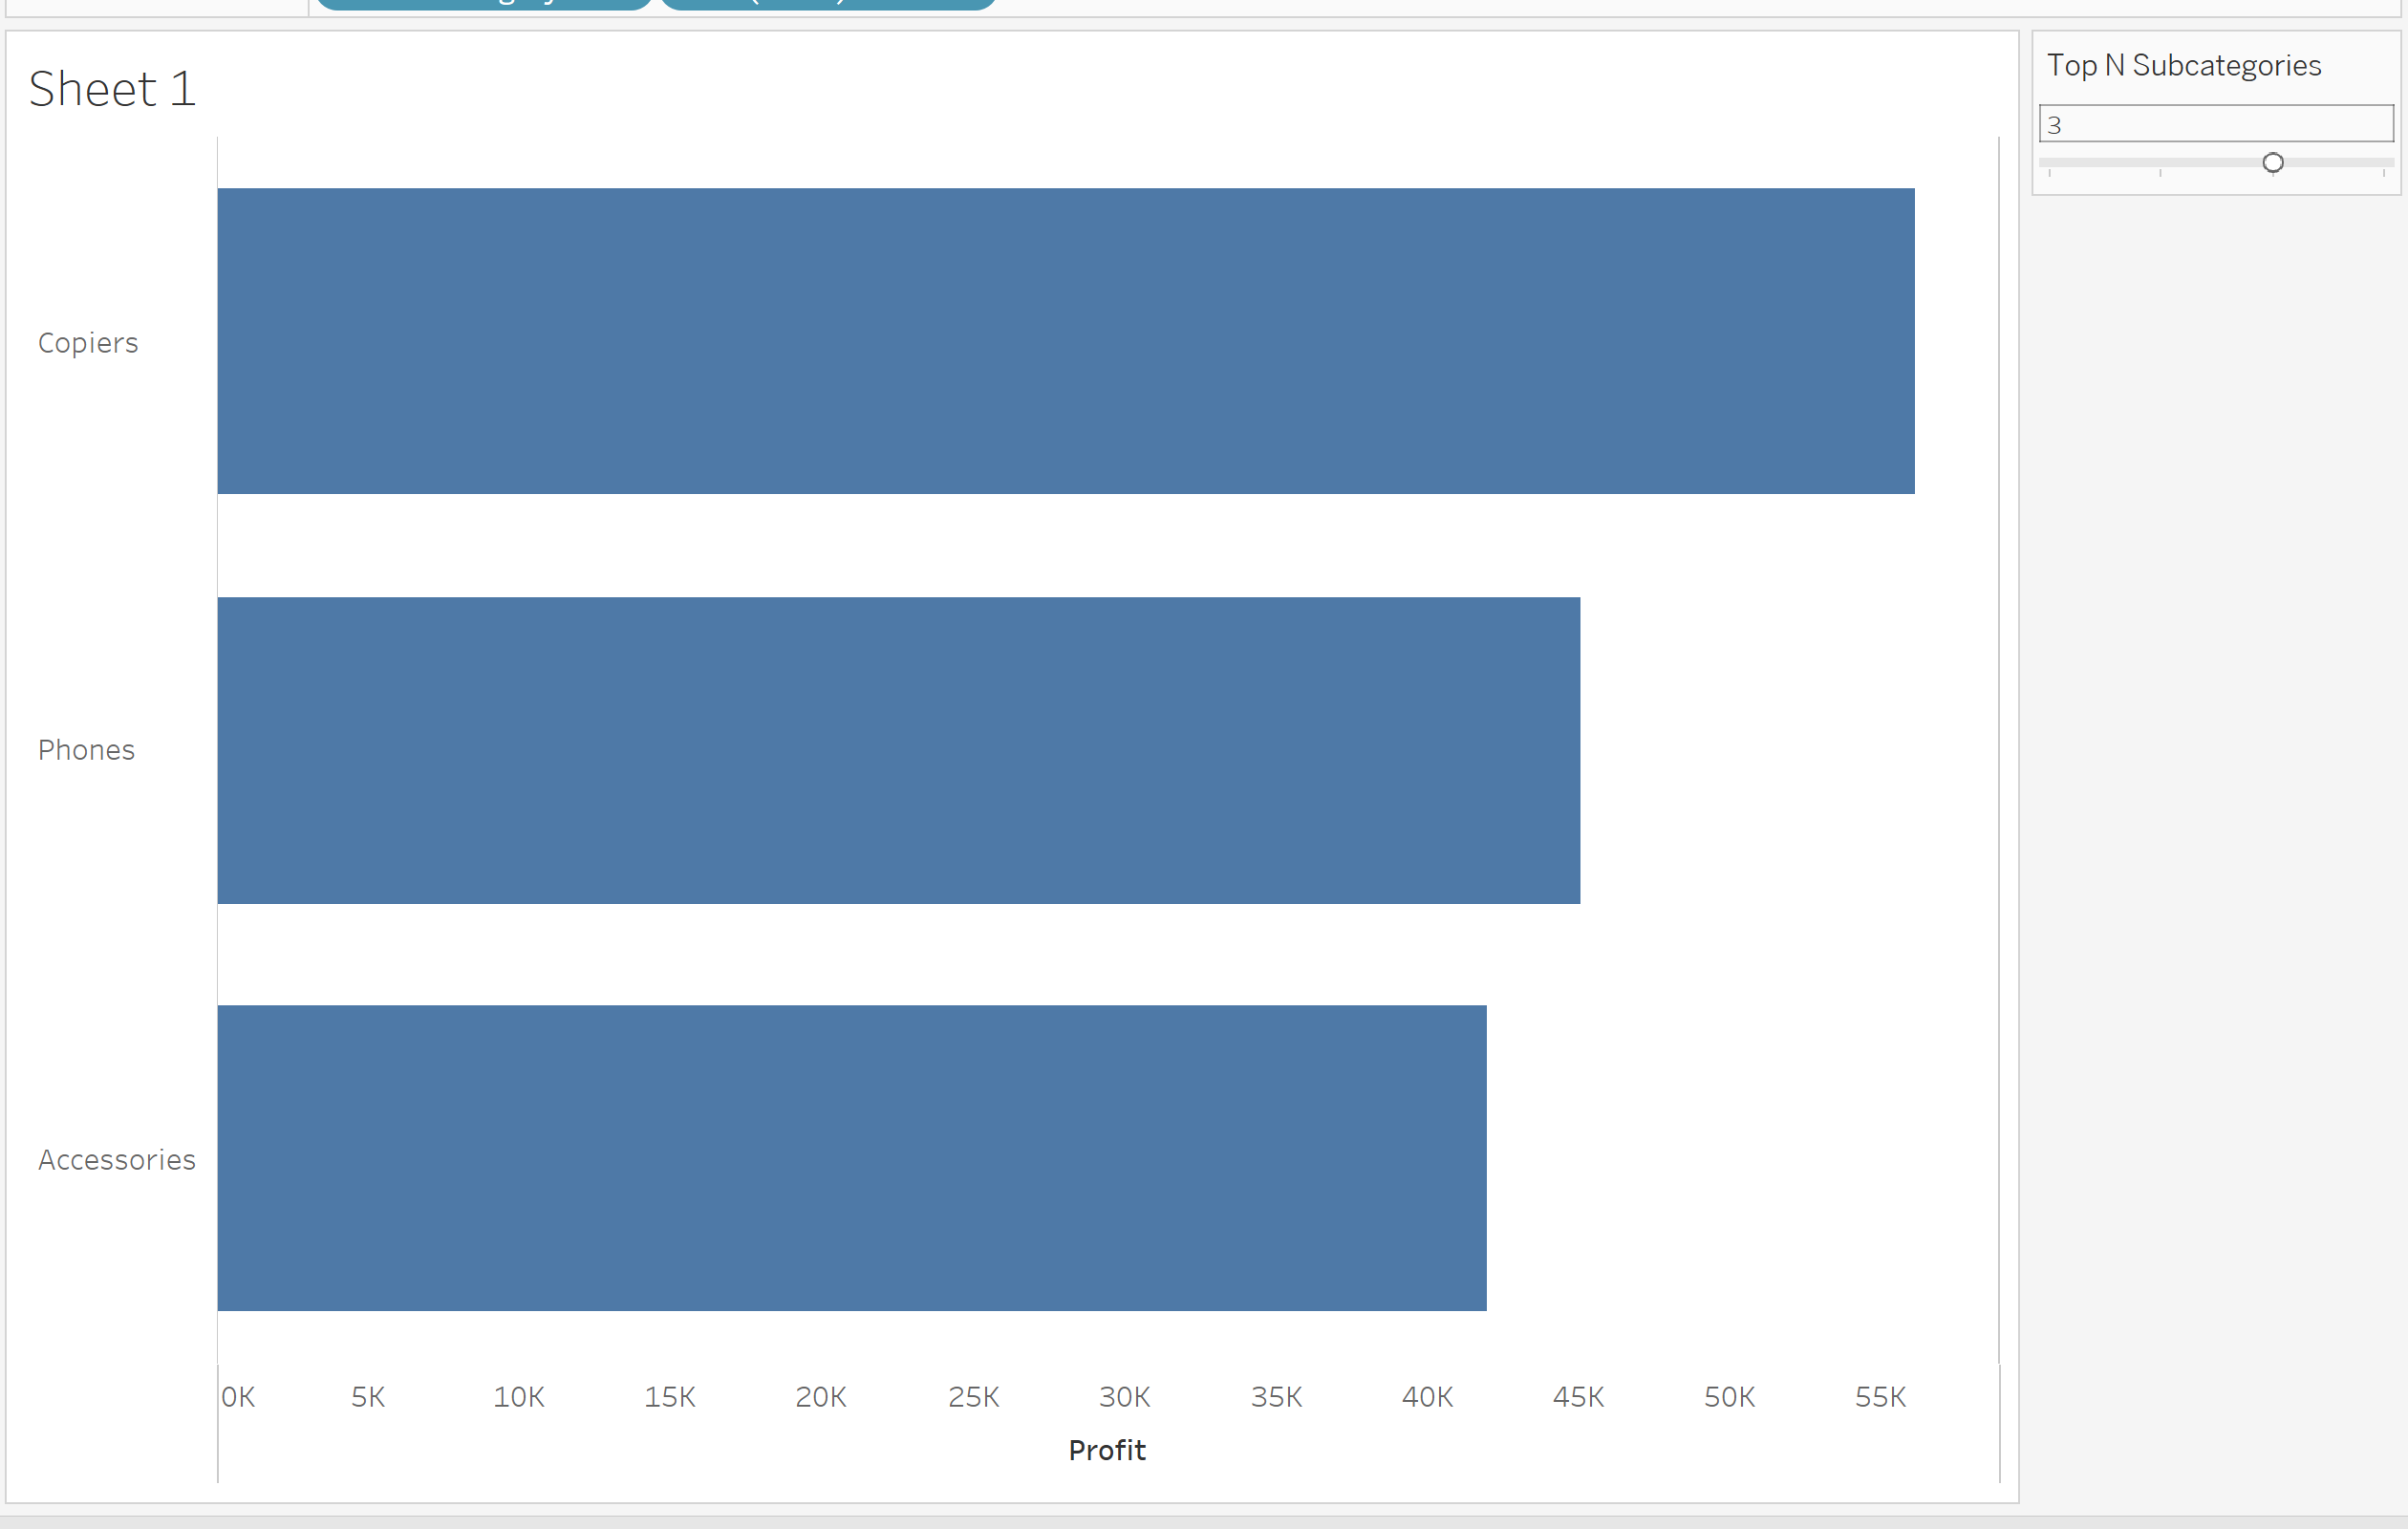
I encourage you to have a play around with colours, headings and styles and see what you can make.
