Full disclaimer before I start here, this is a technique I used in my application - not one I was taught in the data school so it may not be best practise, but I think it looks pretty cool.
So to start, you first have to select an image - it's easiest to select one which only has 1 or 2 colours. Here I'll be using the Marvel Logo.
I'll the open up the site Automeris and click file and load image. In the next pop up window click image and align axis.
Next, in the bottom right "Automatic Extraction" section, select the foreground colour of your image. Mine is white with a black background, so I'll select white.
Just underneath, in the "Algorithm Averaging Window", there is a delta X and delta Y section, playing around with these will alter the number of data points (shown in the bottom left) made. You'll need to have slightly more data points than what is in your dataset. I have 16,376 points in my data set. In Automeris I have 18,242 data points created, so there is an excess of 1,866 points.
Once you're happy with the number of datapoints created, click onto "View Data" and then "Download .CSV".
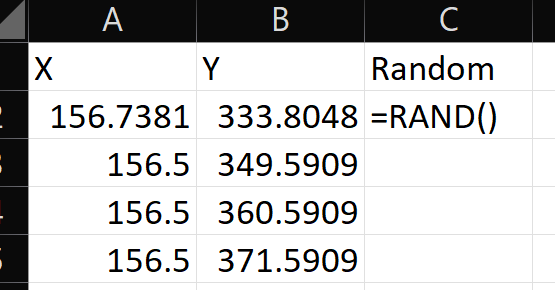
Open up the downloaded Excel document, add an "X" and "Y" header to the data and an extra "Random" header. Add a function in called "=rand()".

Drag this formula down for all of the points. You then want to paste over the values of the random column so the numbers don't keep changing.
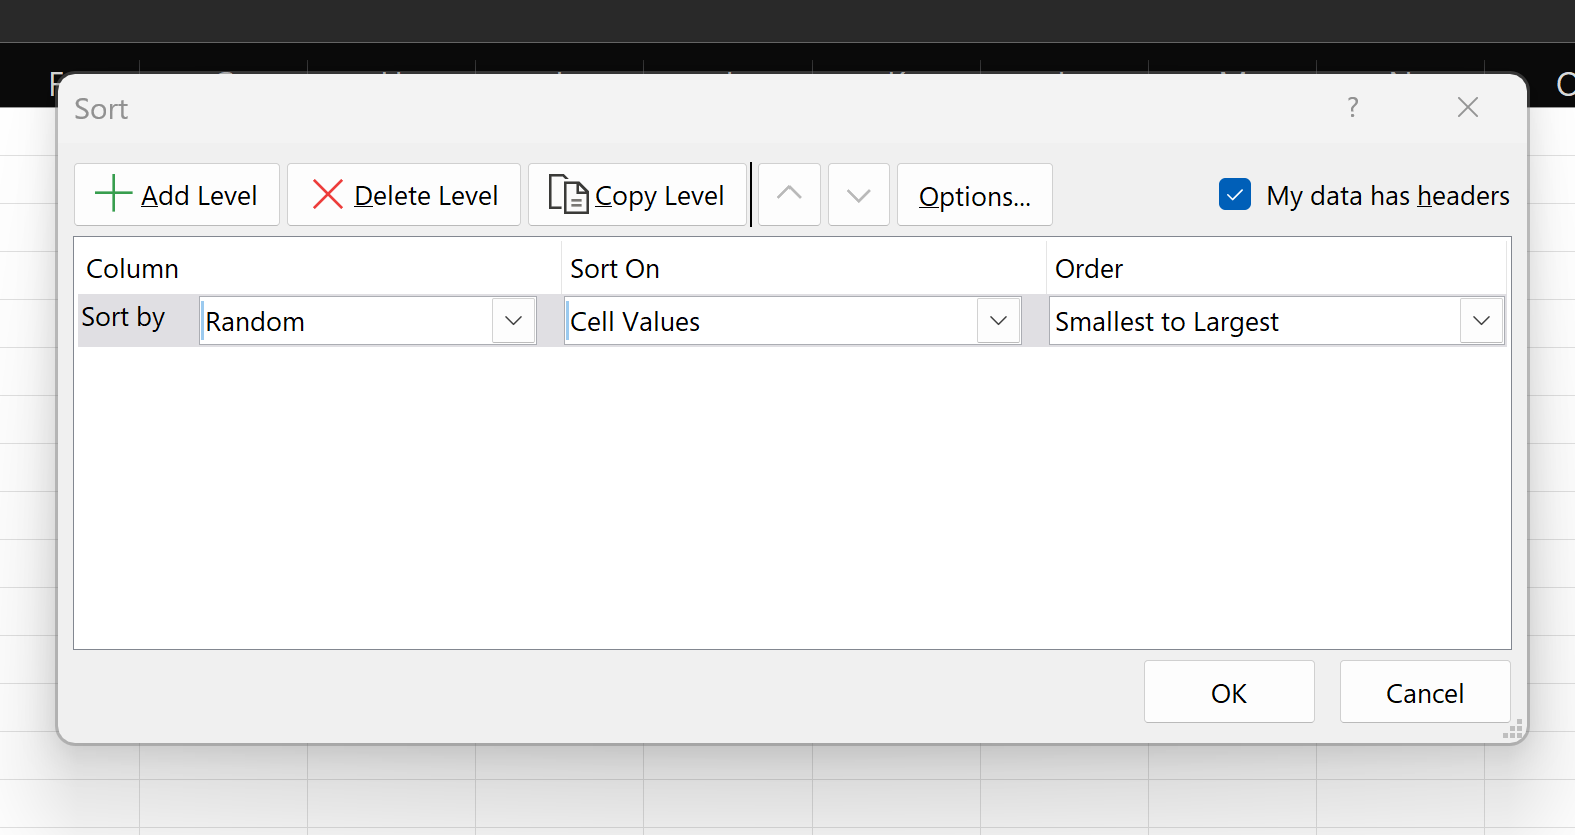
Go into the "Data" tab and sort the data by the "Random" column.

Essentially the above steps allow us to randomise the position of the data points. Now we can delete our excess points (in my case 1866 rows) and move the "X" and "Y" columns into our original dataset. If we'd done this first, it would've deleted data points from the same section of the image rather than randomly.
Back in Tableau we can add "X" to our rows and "Y" to our columns. Change both of these to dimensions. Reverse the y axis.
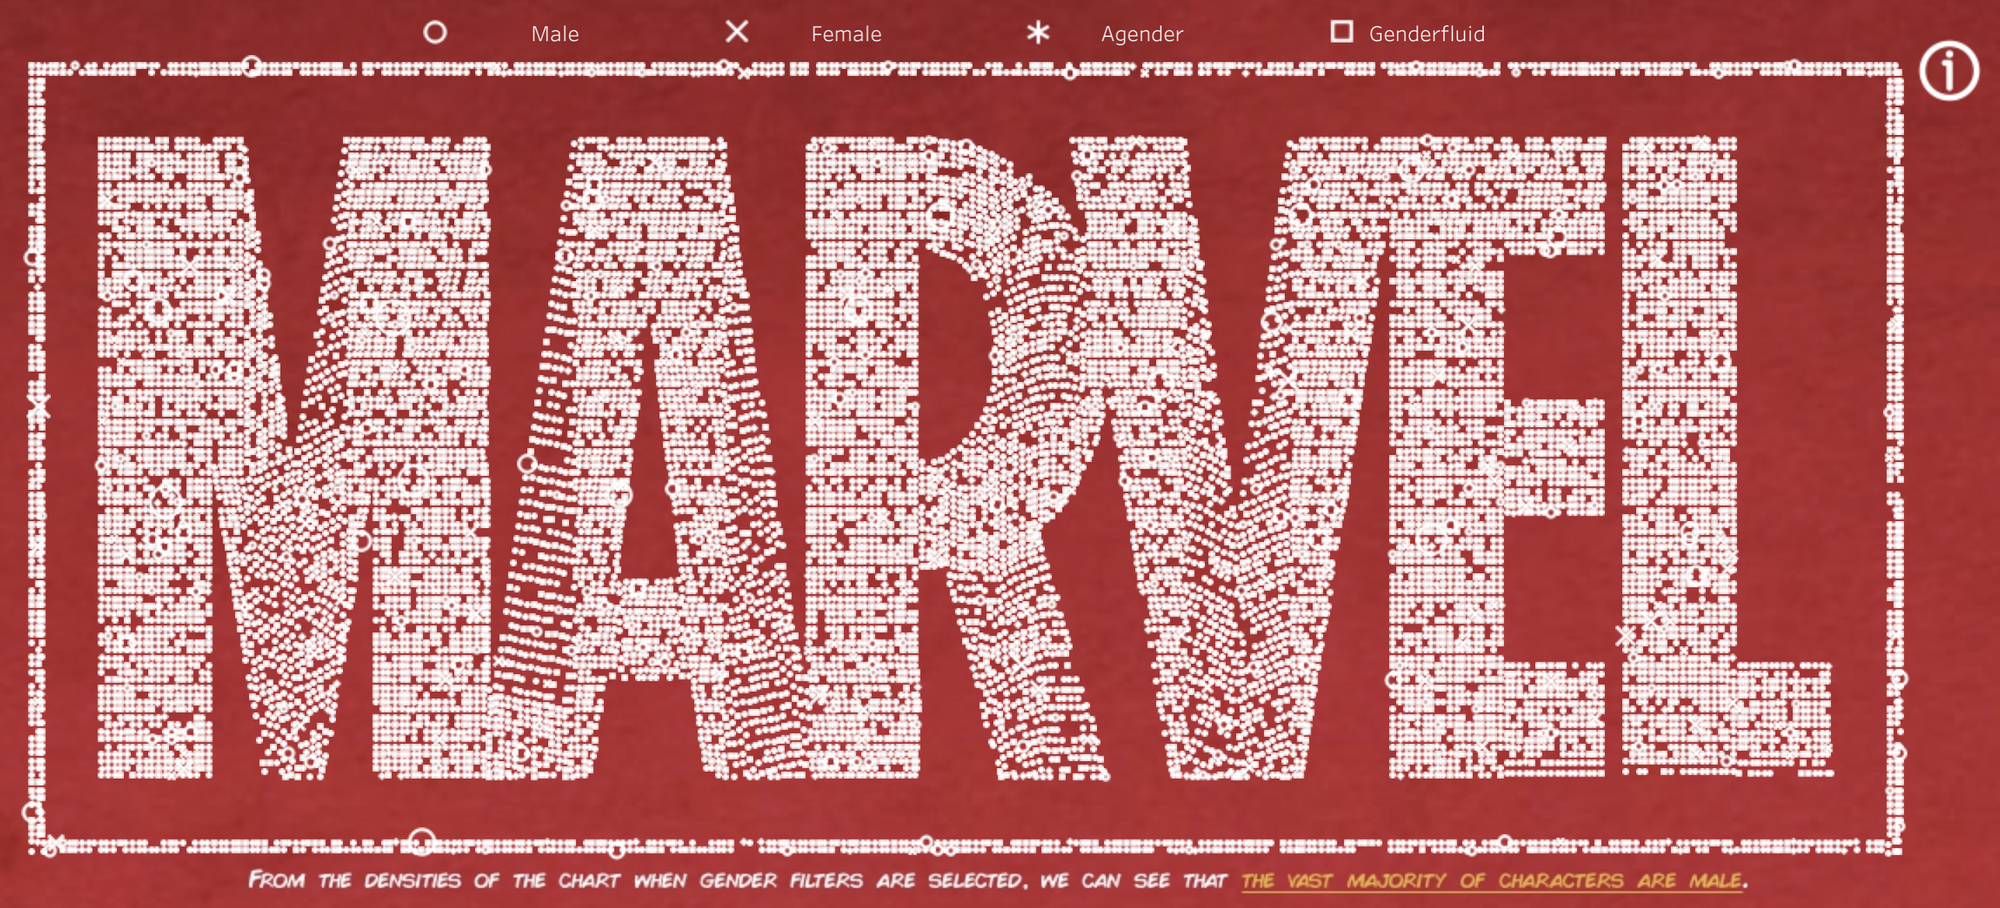
And tadaa, we have our image. I'd encourage you to play around with the shapes and colours and add in some filters. Here's what I ended up with.

