Pivots in Alteryx feel a little confusing, for starters they aren't even called Pivots, they're called Crosstabs and reverse Pivots are Transposes. Once you get going everything starts to make sense and you realise that Alteryx gives quite a lot of control over the output.
Lets start with Crosstabs (or Pivots). Imagine we have the data below.
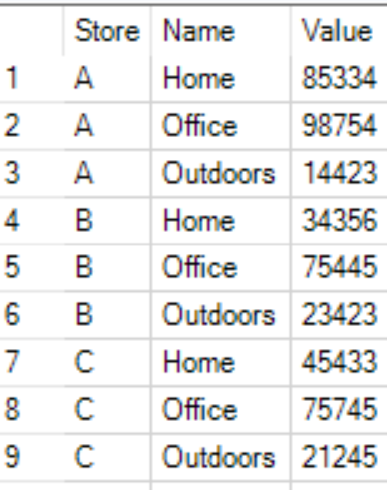
This data isn't arranged too sensibly... Realistically, we would be able to do a lot more if the data in the "Name" column were made into headers, like below.
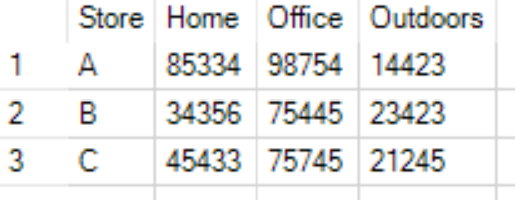
So how do we go about achieving this?
Lets load the data into Alteryx and grab our crosstab tool.

Now look in the configuration pane. In our output, our data is grouped by "Stores". We're looking to change pivot our "Name" column, so that goes into the change column header. The "Name" column's corresponding values are in the "Value" column. For this example, we also want our aggregation to be a Sum.
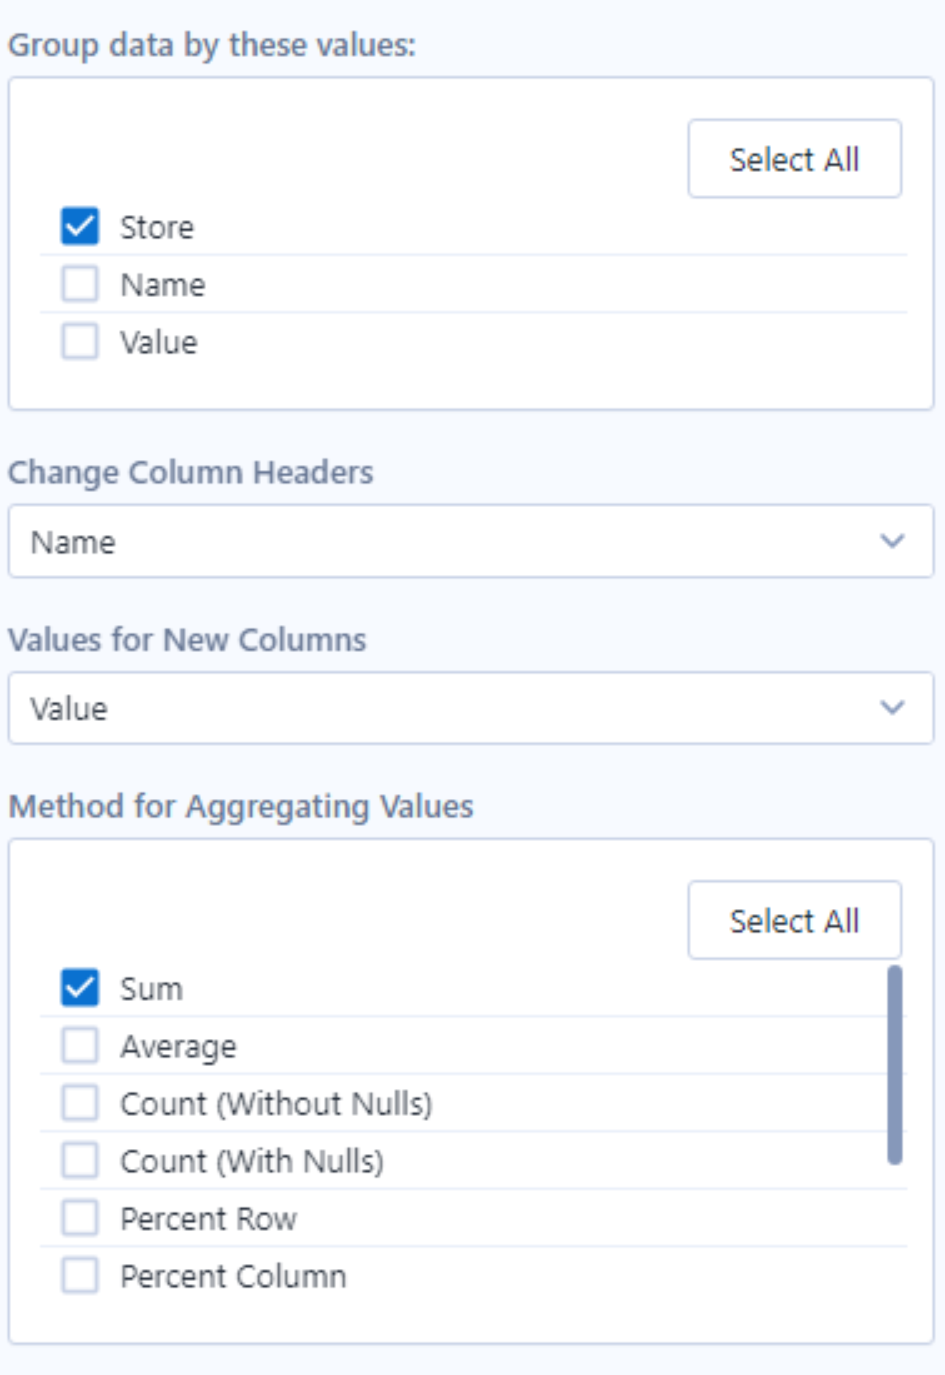
Press run and voila we have our output!
Now lets think about reversing the situation. What if we were given this input.
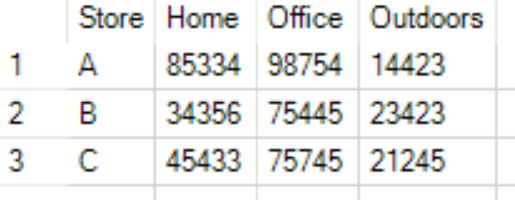
And for some (unthinkable) reason we want this to be our output.
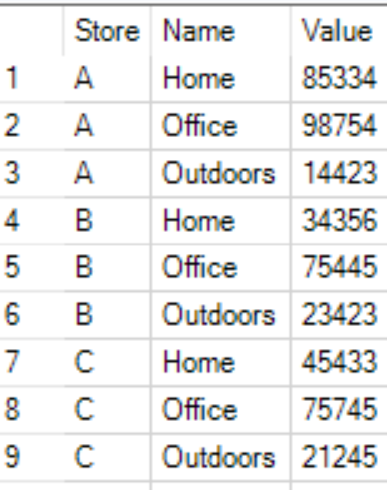
In this case we want to convert our rows into a "Name" column. So again, lets load the data into Alteryx.
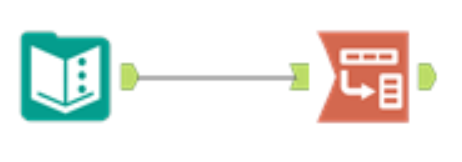
Note the subtle change in icon between Cross tab and Transpose.
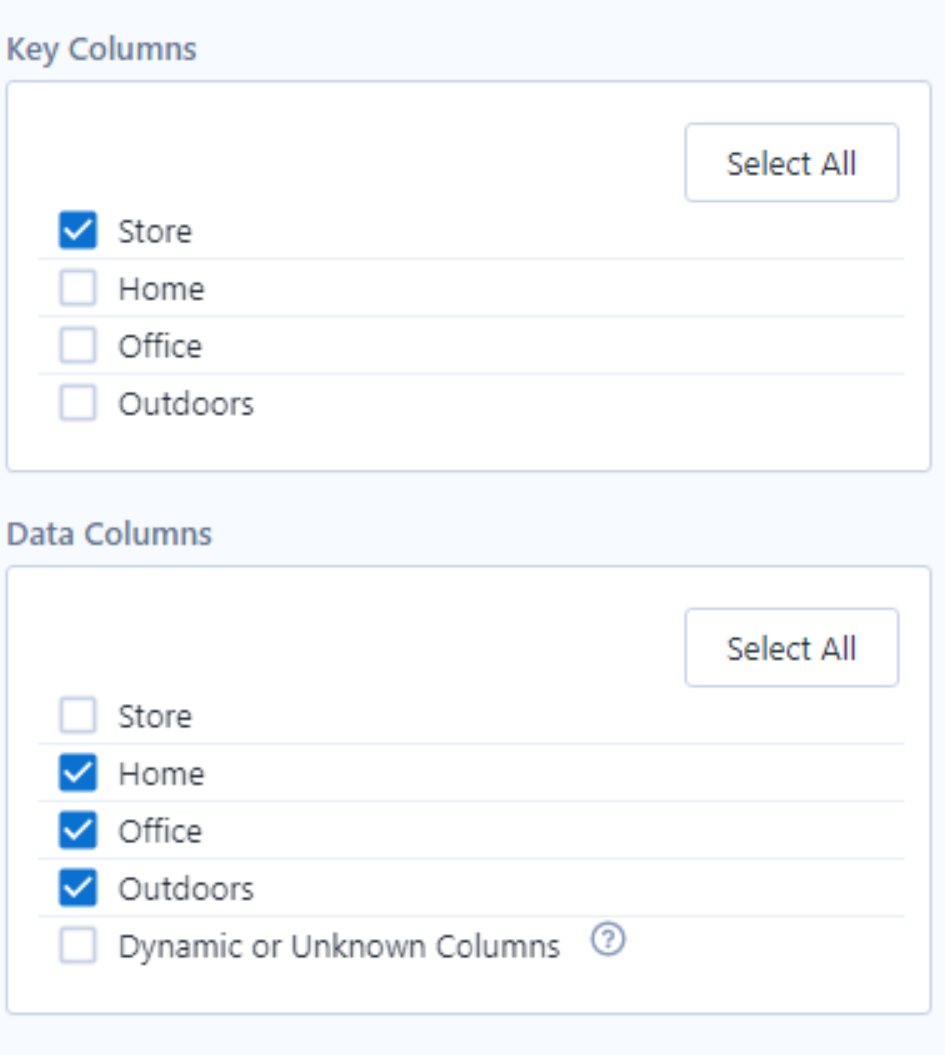
This time our task is slightly simpler, we want "Stores" to stay the same so this is our Key Column. "Home", "Office" and "Outdoors" are the fields that we want to transpose so they go into our Data Column.
And that's it, we're done!
