


I’m excited to kick off a new series comparing the data preparation workflows of Tableau Prep and R.
First things first: What is R?
R is a programming language specifically designed for statistical computing and graphics. While it’s a staple in academic research and heavy-duty statistical modelling, its true strength lies in its flexibility—giving you total control over how you clean, transform, and visualise your data.
While I might argue that tools like Tableau or Power BI offer a way better visualisation experience, the journey to get there will always be the same: Data prep!. Every software has its own "philosophy" for handling data, and comparing them reveals a lot about how we may solve the same/common problems.
The challenge I was working on this week is: https://preppindata.blogspot.com/2024/02/2024-week-6-staff-income-tax.html
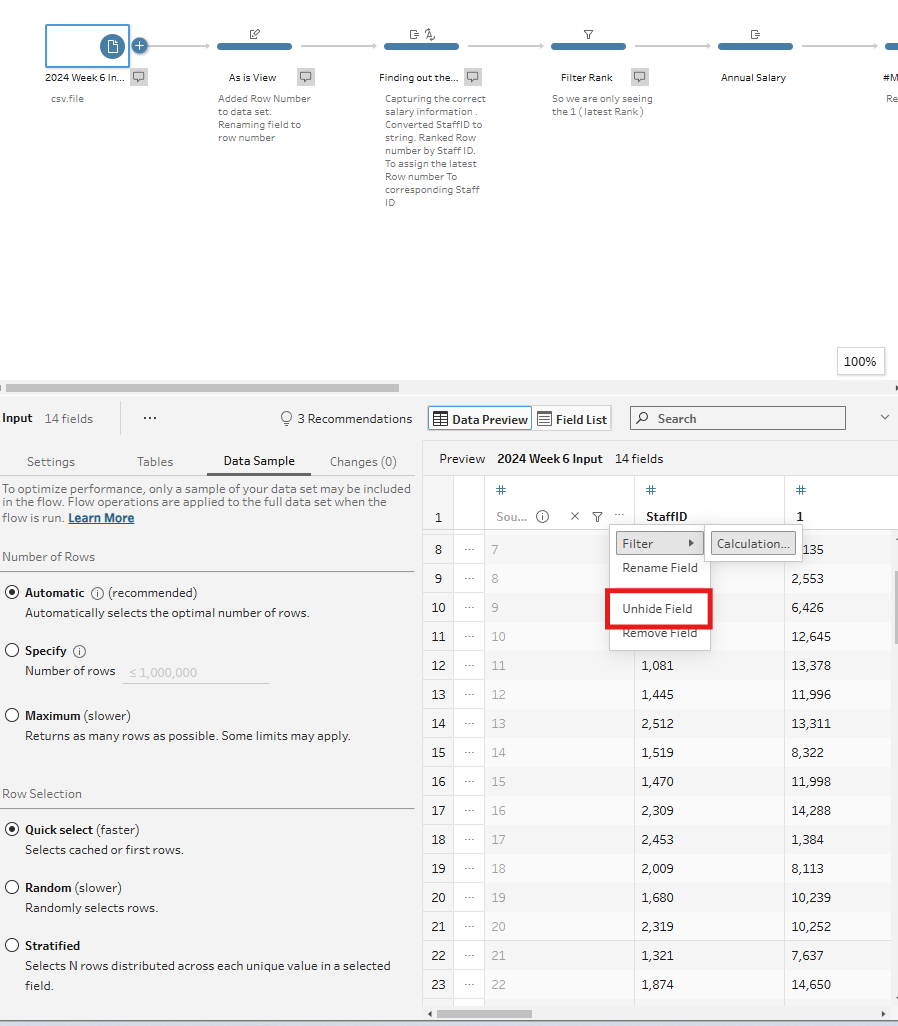
Step 1 - Add Row Number field to the dataset
In Tableau Prep:
By Default, tableau places a 'Source Row Number' when connecting to the file of interest. You can bring this through via clicking on the 3 dots and selecting 'Unhide field'.
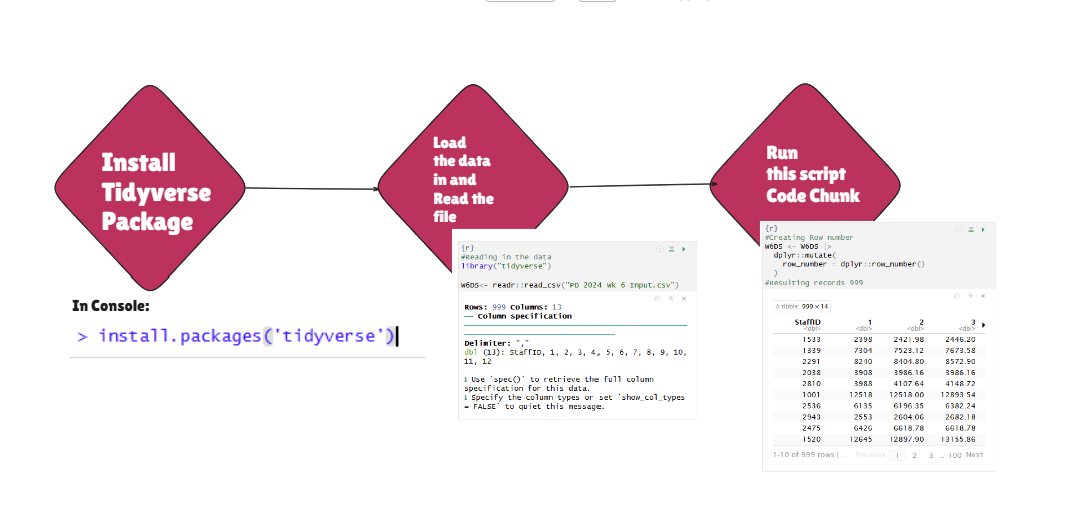
In R, It is a bit different, There are a few steps to do this.
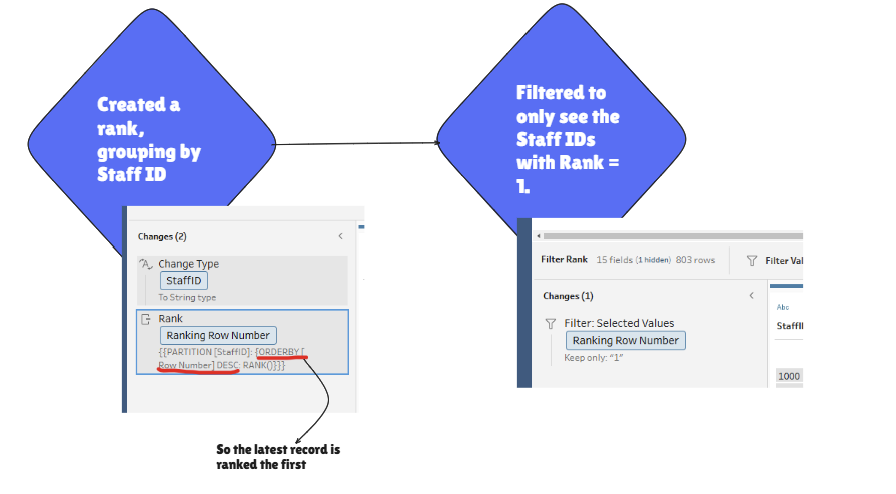
Step 2 - Only returning the latest rows to make sure you are looking at the most recent information of a team member.
In Tableau Prep
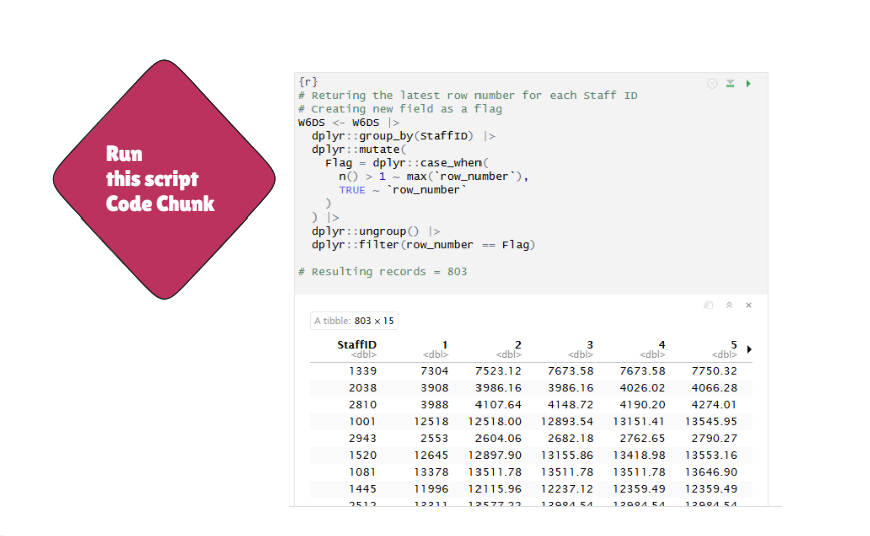
In R
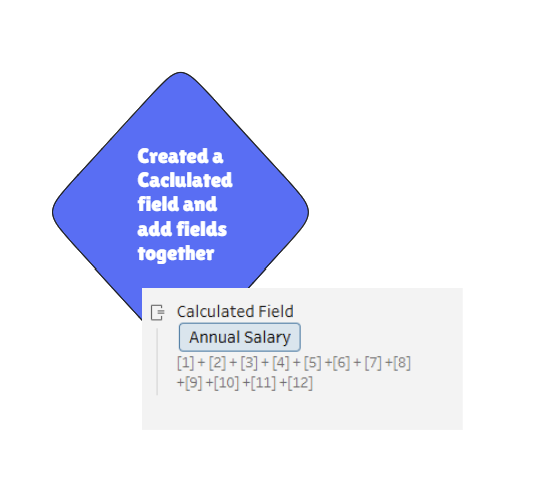
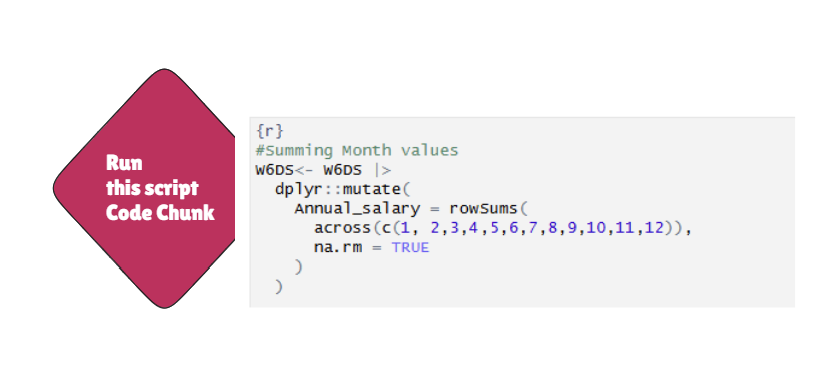
Step 3 - Calculating the Annual salary
In tableau Prep
In R
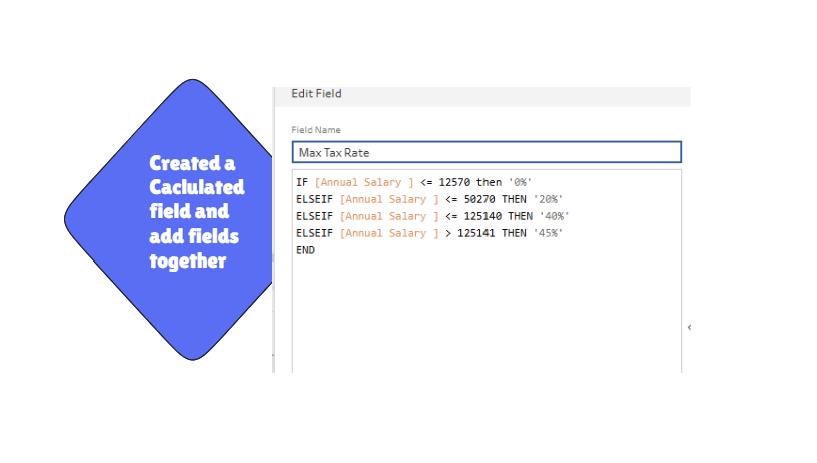
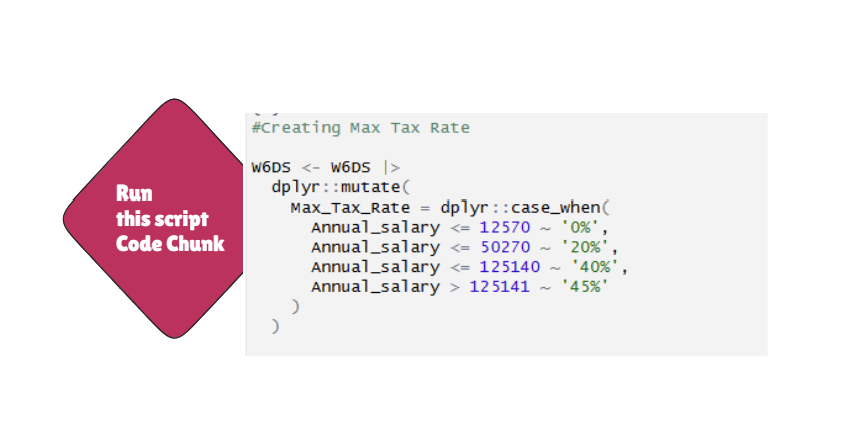
Step 4 - Creating the Tax band Category
In Tableau Prep
In R
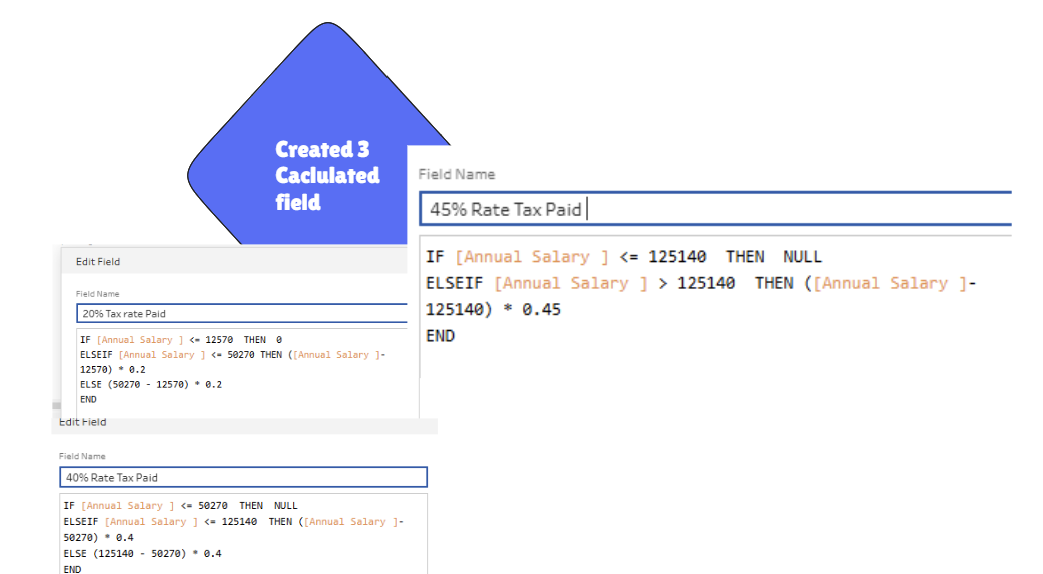
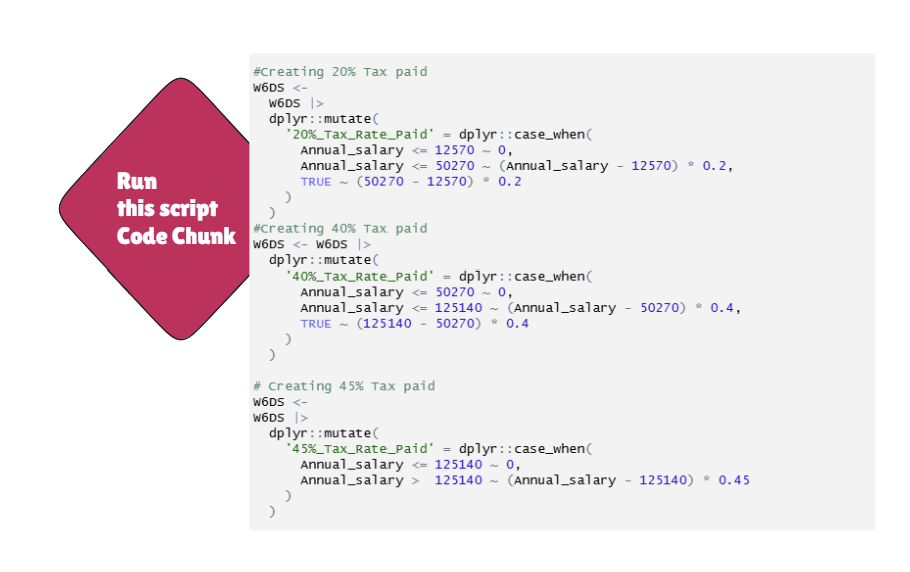
Step 5 - Tax Paid Logic
In Tableau Prep
In R
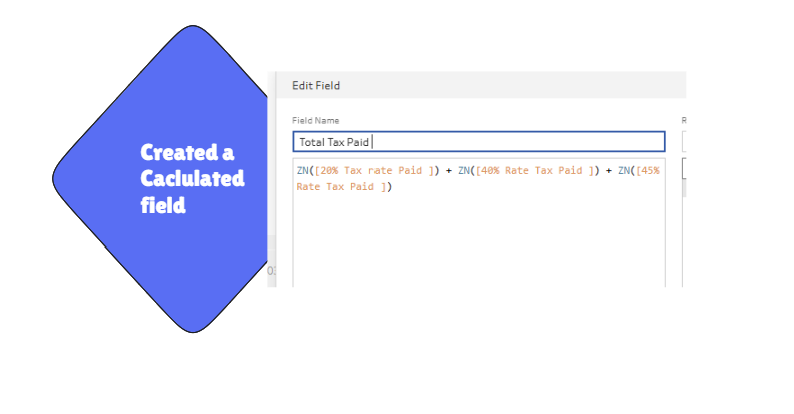
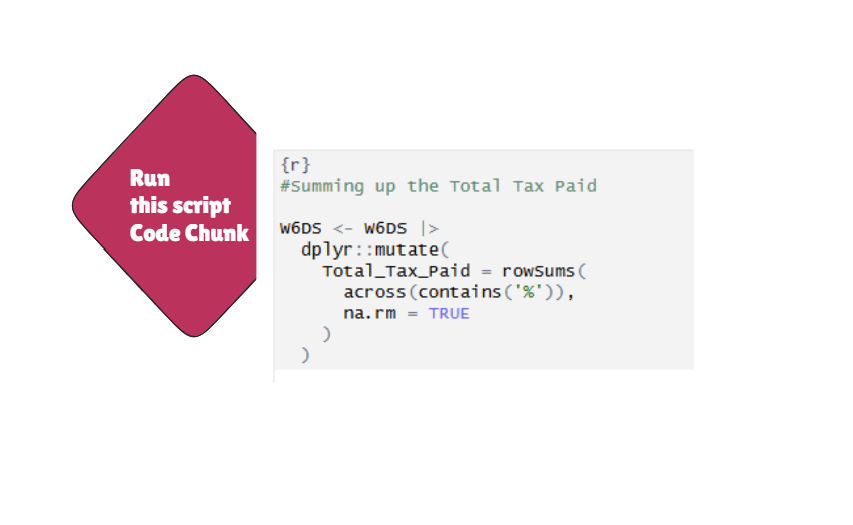
Final Step - Summing up the Total Tax Paid by Team Member
In Tableau Prep
In R
Output Links
For Tableau Prep
For R