This blog is a continuation of my 'What is Microsoft Fabric?' Blog posted a week ago. Here is more of a tutorial on how to create a Data Lakehouse within Fabric. And some features you are able to do once you have created a data Lakehouse.
What is a Data Lakehouse?
A Data Lakehouse is a space where you are able to store different types of data (quite similar to a data lake). Both Structured and Unstructured data in a slightly more systematic way. Its main advantage, or proposed solution, is to combine the structure you see within a warehouse and the flexibility of Data Lakes.
Lakehouse Design
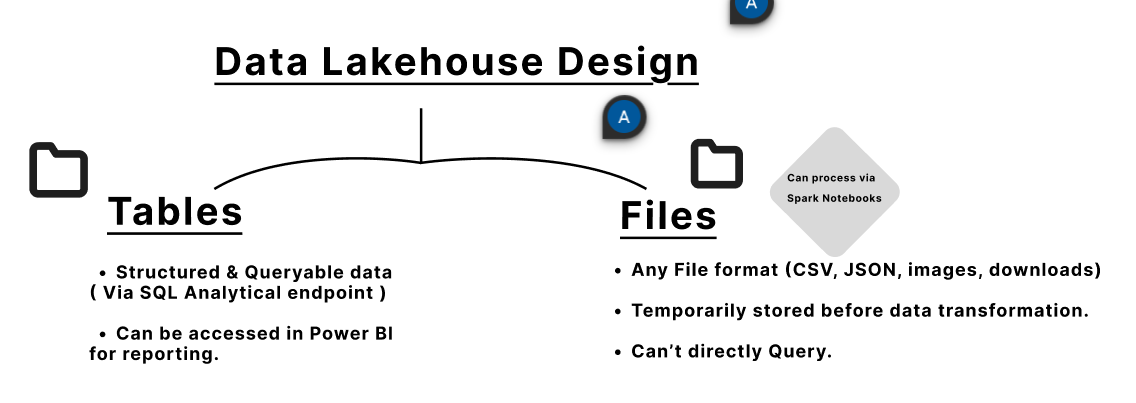
In Fabric, two categories host both structured and Unstructured data.
- Tables (mainly deals with Structured data)
- Files ( Typically unstructured data)
One idea to note is that when a table is created in a Lakehouse in Fabric. it is automatically stored as a Delta table within the underlying OneLake Storage.
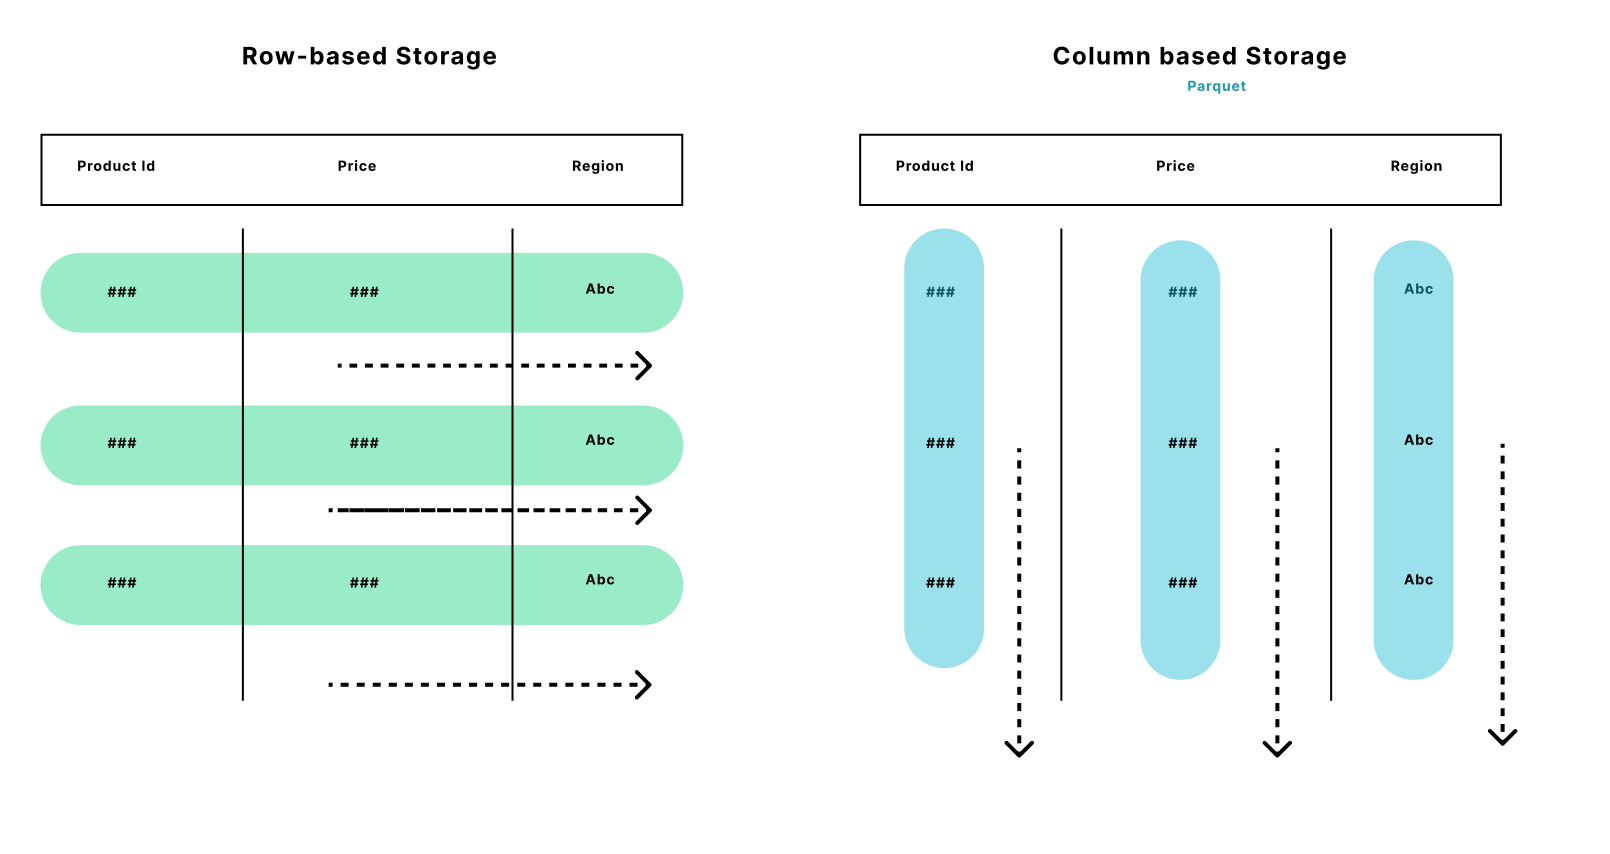
What is a Delta table? It is a type of table that hosts 'Parquet data', which is a different way to process your data; it stores data sequentially by columns. So instead of data being stored the way we read it ( Left to right), it is stored field by field.
Creating and Exploring a Lakehouse within Fabric
Prerequisites
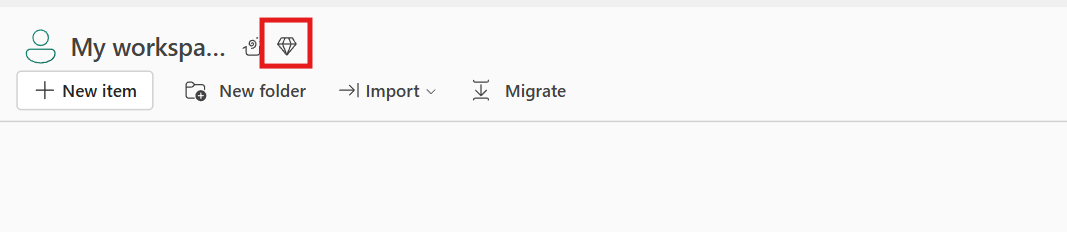
- To create a lakehouse in Fabric, you need to add capacity to your current Fabric Trial. ( If you currently have a Fabric trial for your particular workspace). You will know if this has been added by seeing a Diamond icon next to your workspace.
Step 1 - Creating a Lakehouse in your workspace
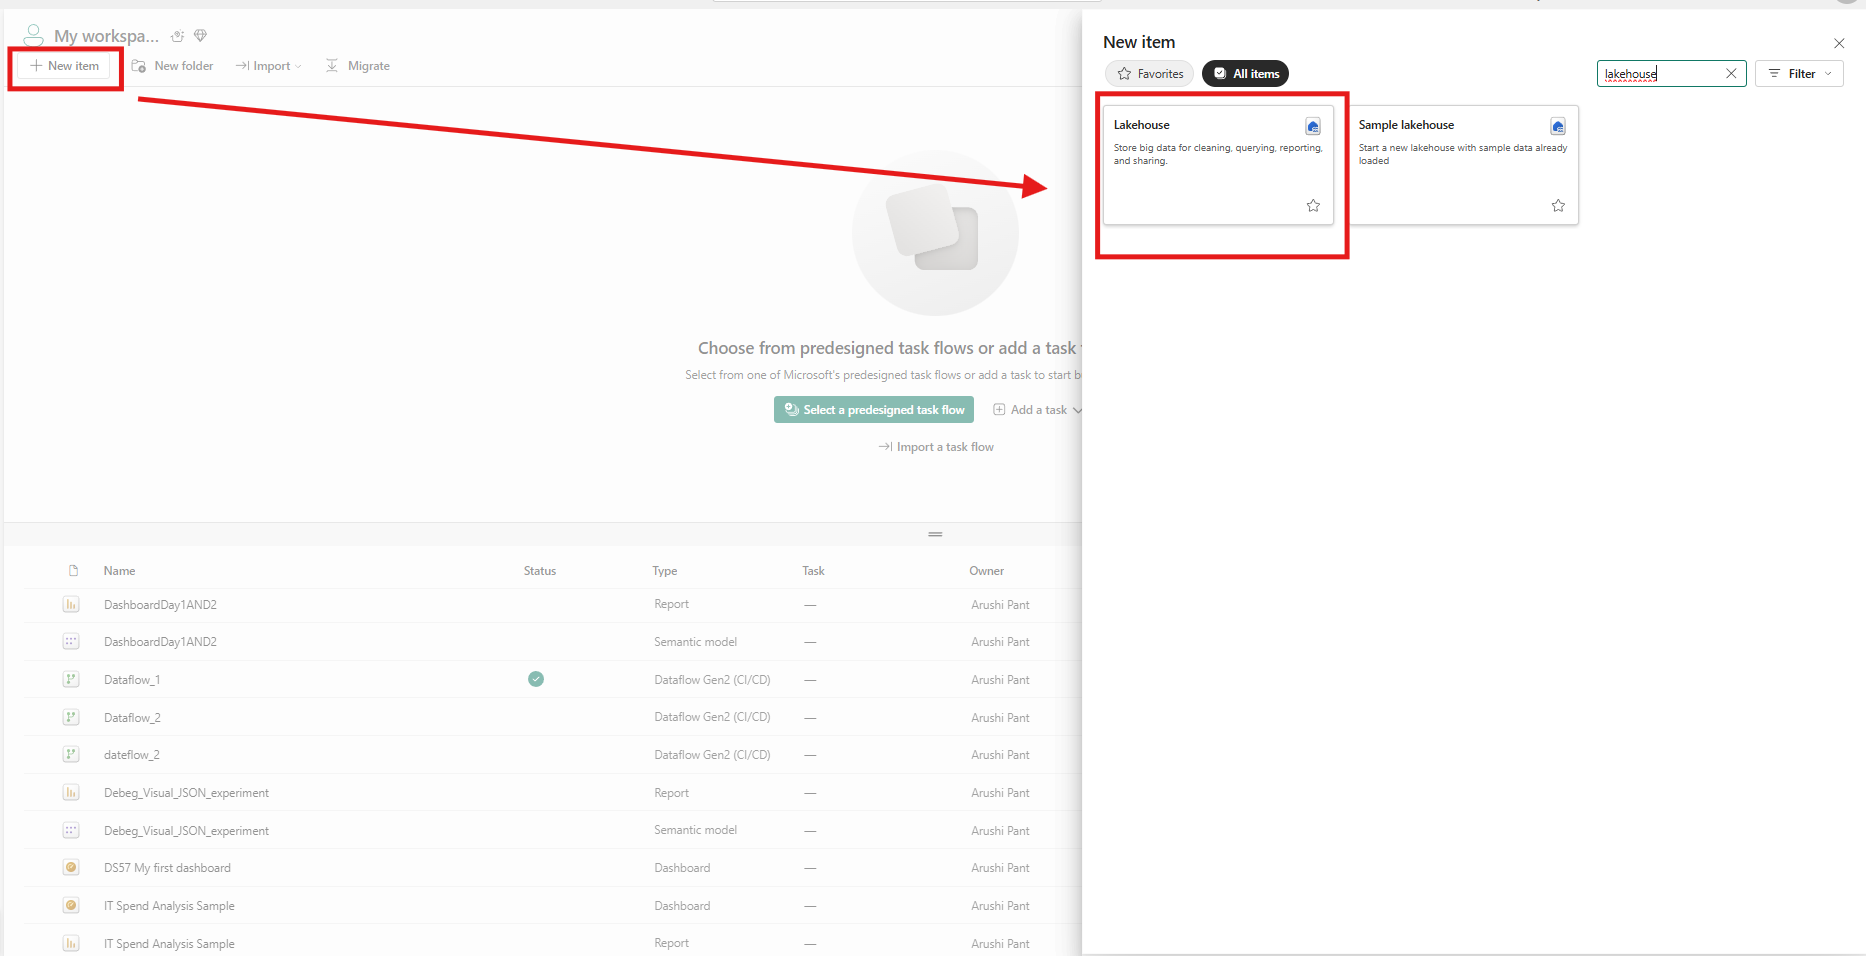
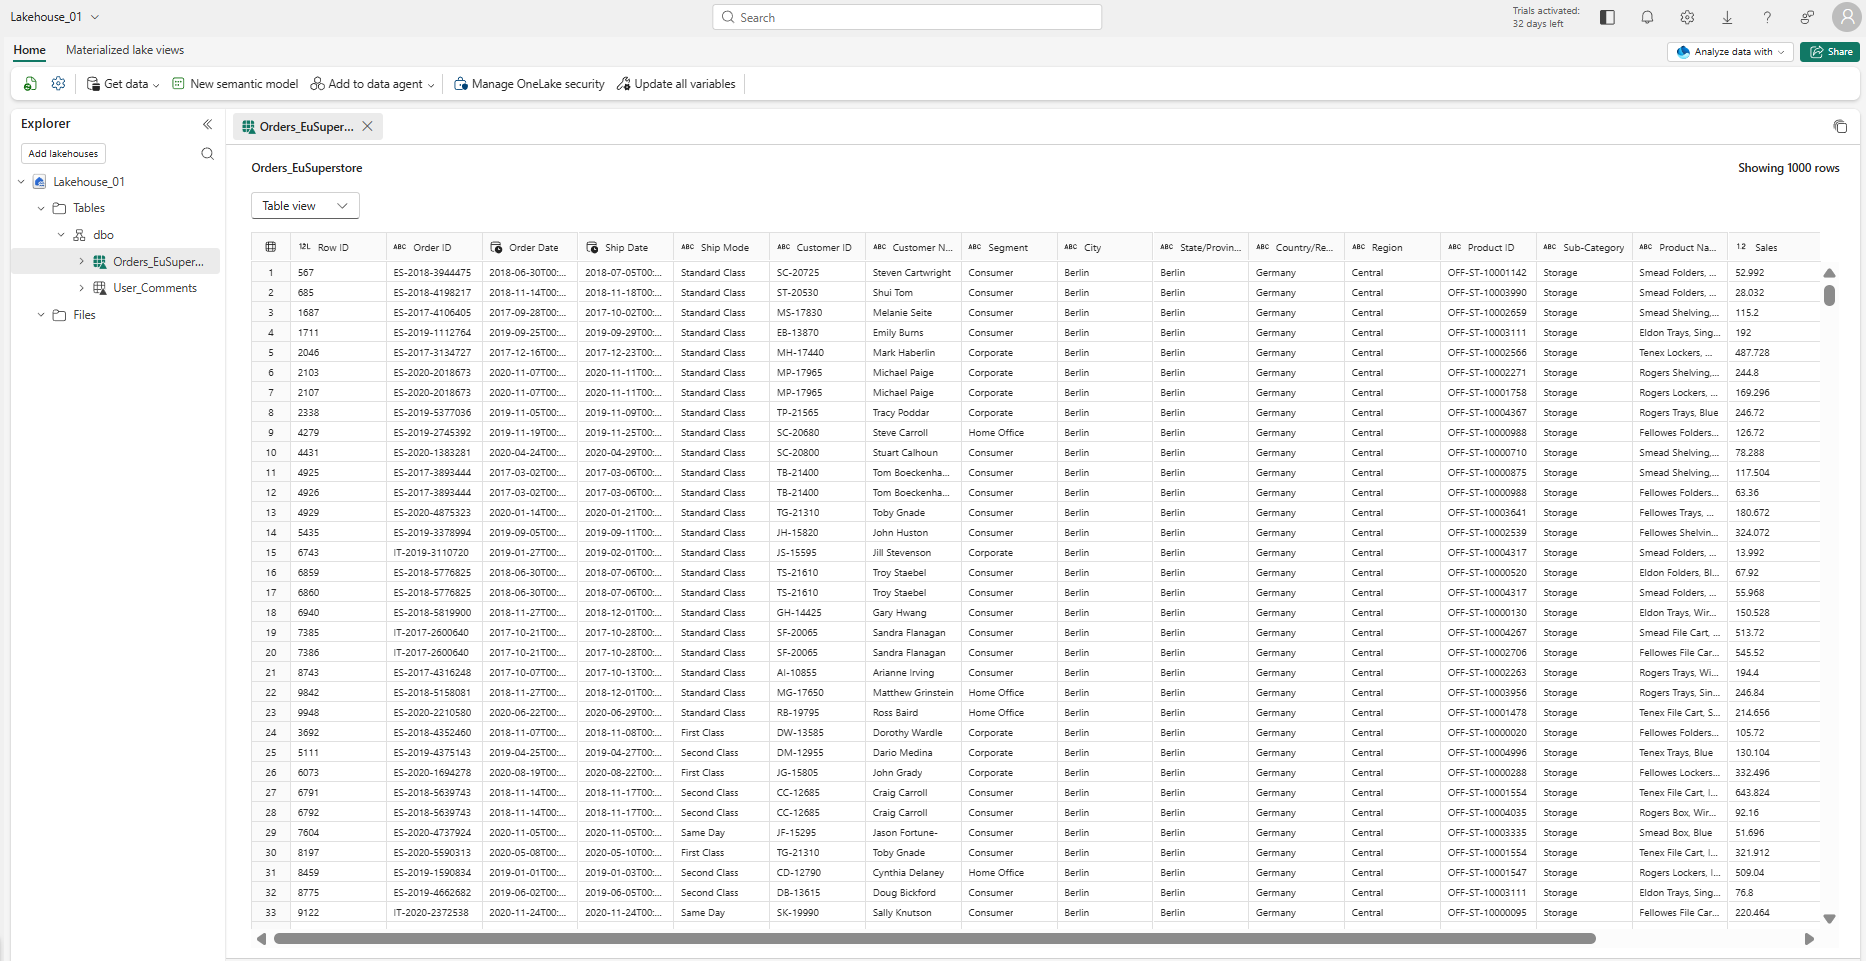
When you create a lakehouse in Fabric, a dbo schema will be enabled by default.
- You can create other schemas to keep tables organised as your organisation's lakehouse grows.
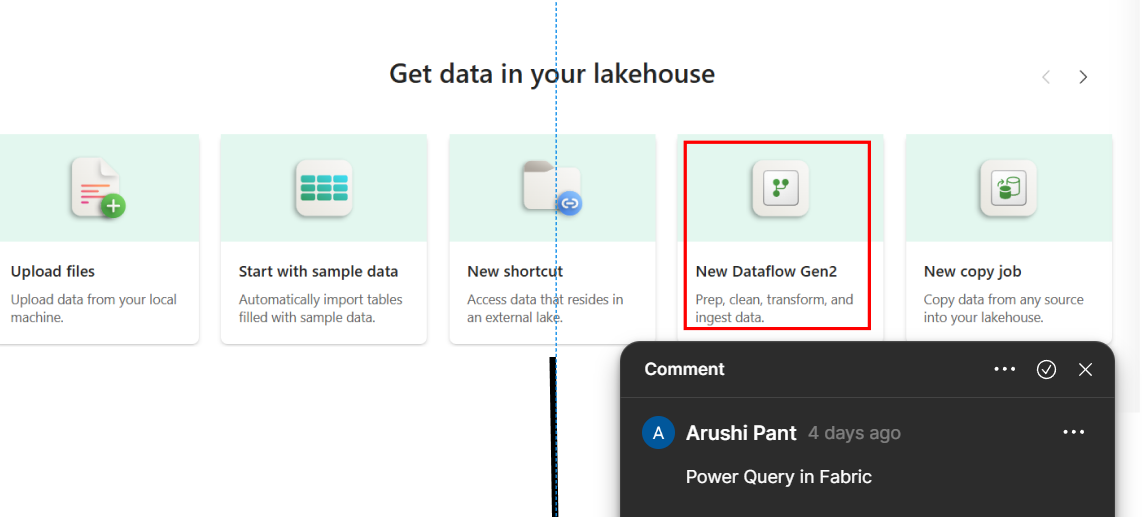
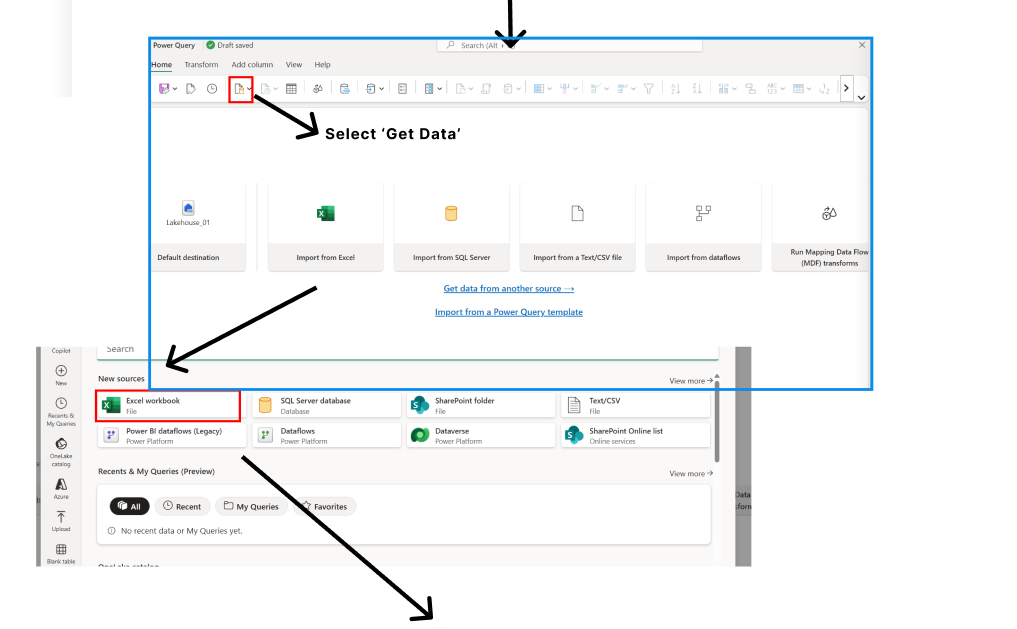
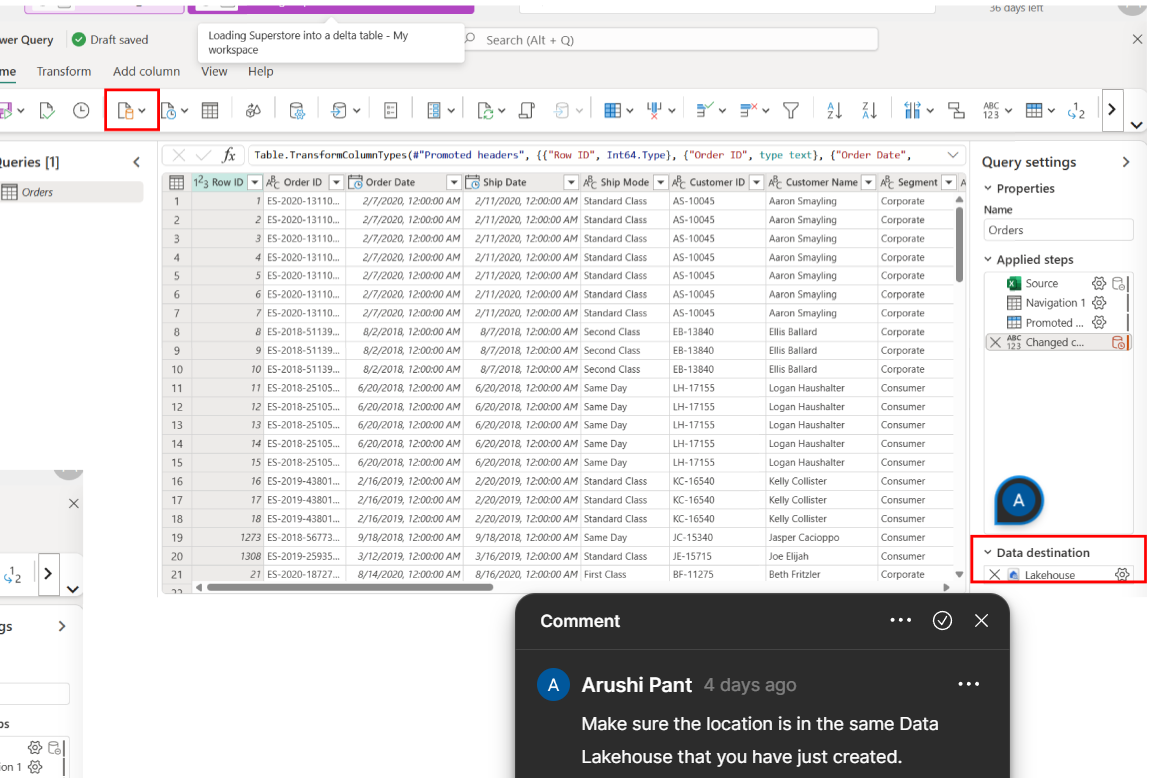
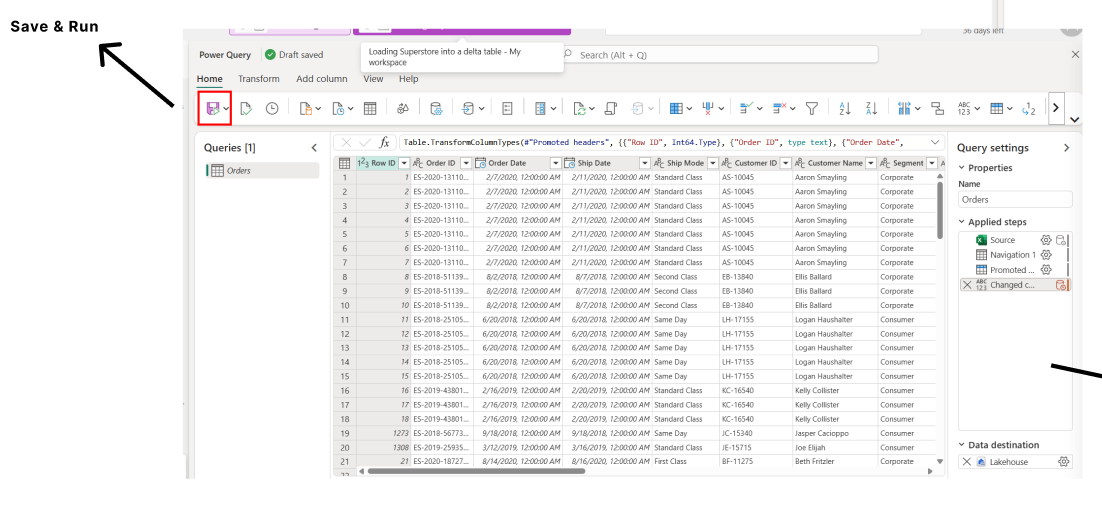
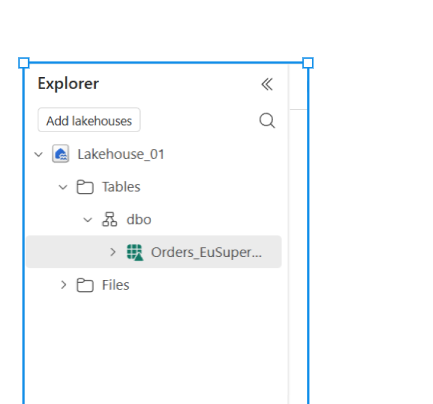
Step 2 - Creating a Table Within your Lakehouse (from a xslx file)
Once you have clicked into your lakehouse in your main canvas, you should see the following:
Querying the data from your Lakehouse
Once you have uploaded a table to your lakehouse, you can query the data, create a view, and build quick reports from these views via the SQL Endpoint.
Within your Lakehouse, on the top right, there is a dropdown; originally it would have said 'Analyse data with'. Now let's switch this to SQL Analytical Endpoint.
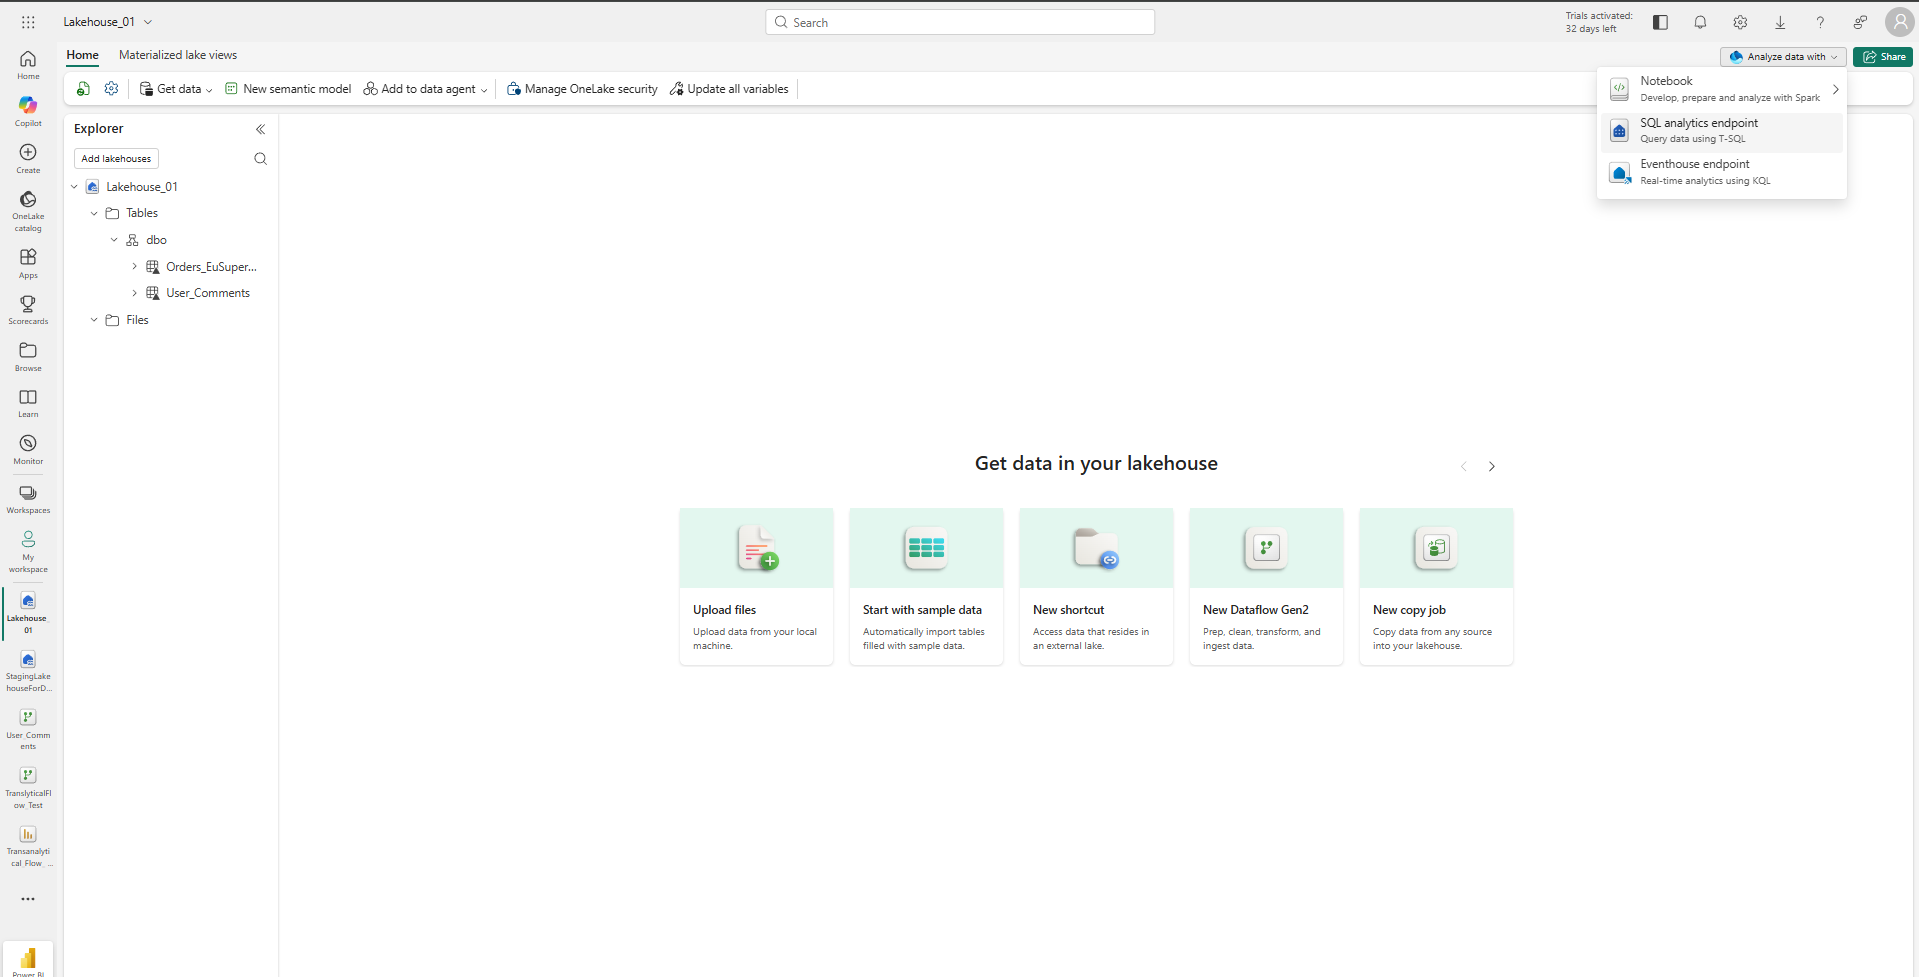
An Endpoint is automatically created in every lakehouse.
It allows you to query the tables without changing the underlying data (read-only access using T-SQL) and is often used for ad hoc queries, BI connections, and data Validation after data transformation steps.
Methods and use cases of Queries
- Can Query the SQL Endpoint via Sparks Notebook
- Used to perform Exploratory Analysis or to prepare data for Machine Learning.
- Can use both Spark SQL and PySpark
- Can use PySpark to query data within the script or connect to an API.
- Can create a View from a Query in Fabric, can then build out a report in Desktop/ Fabric.
Creating, saving a view and building a report within in Fabric
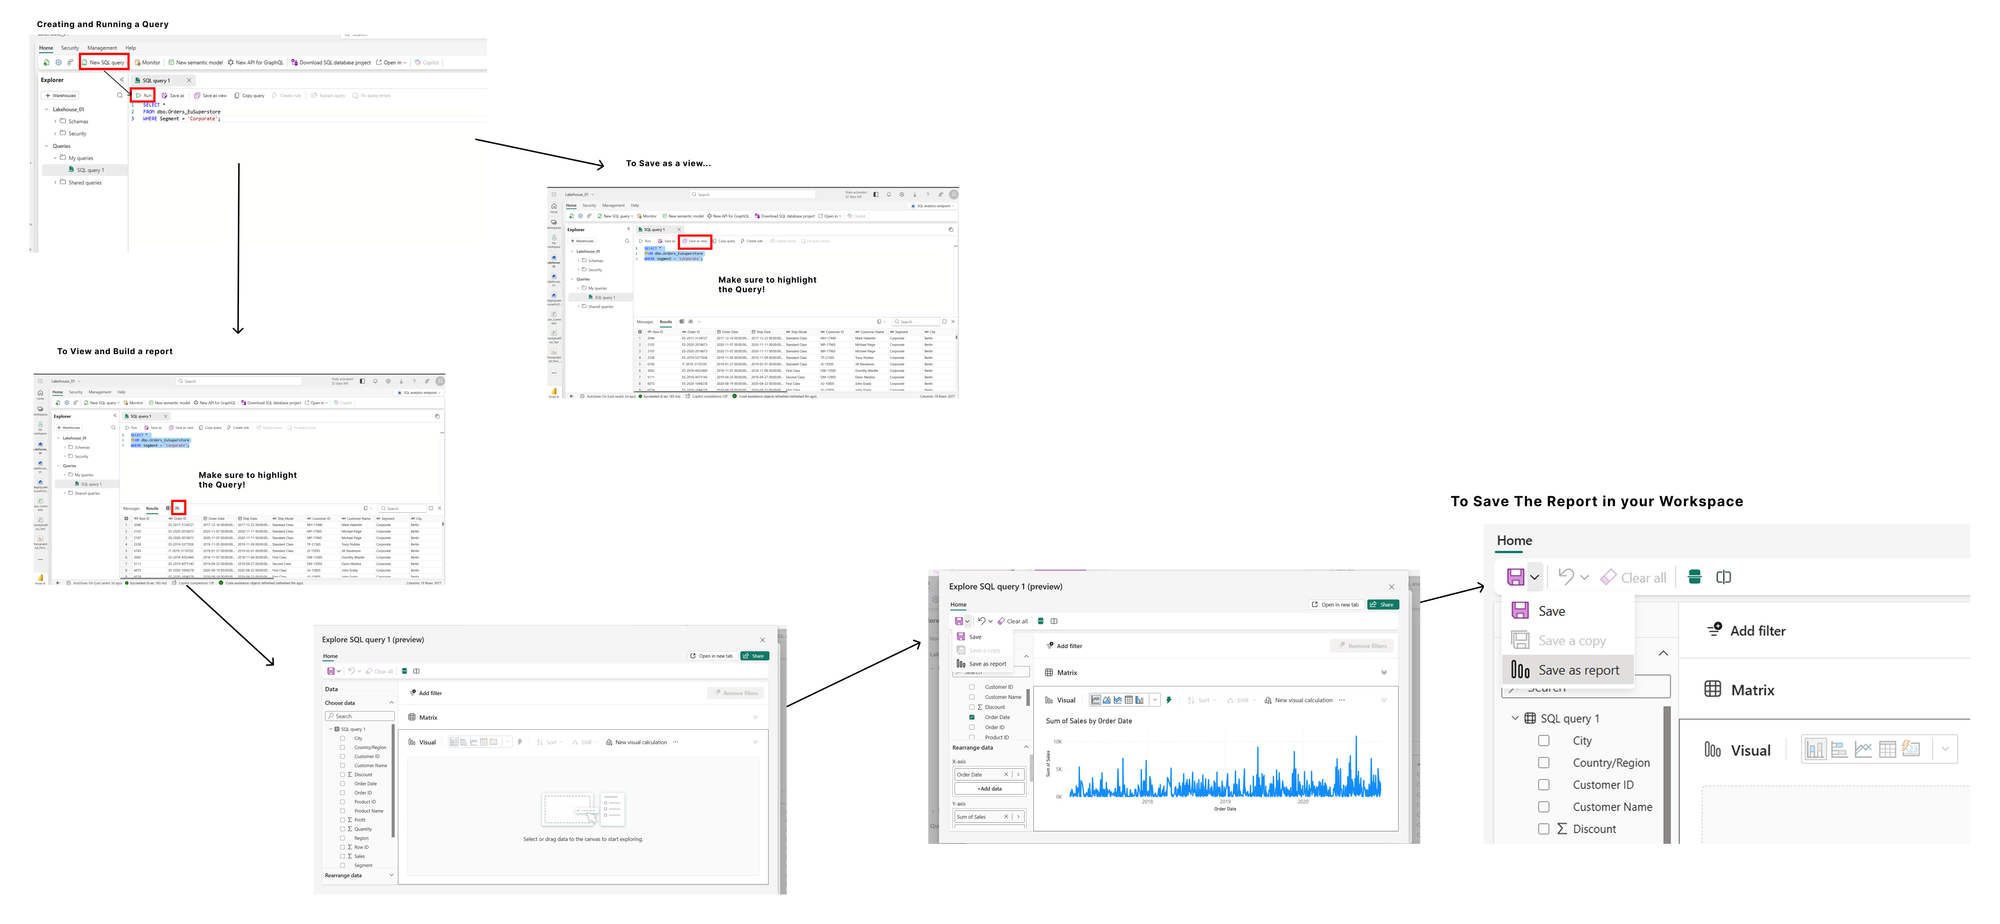
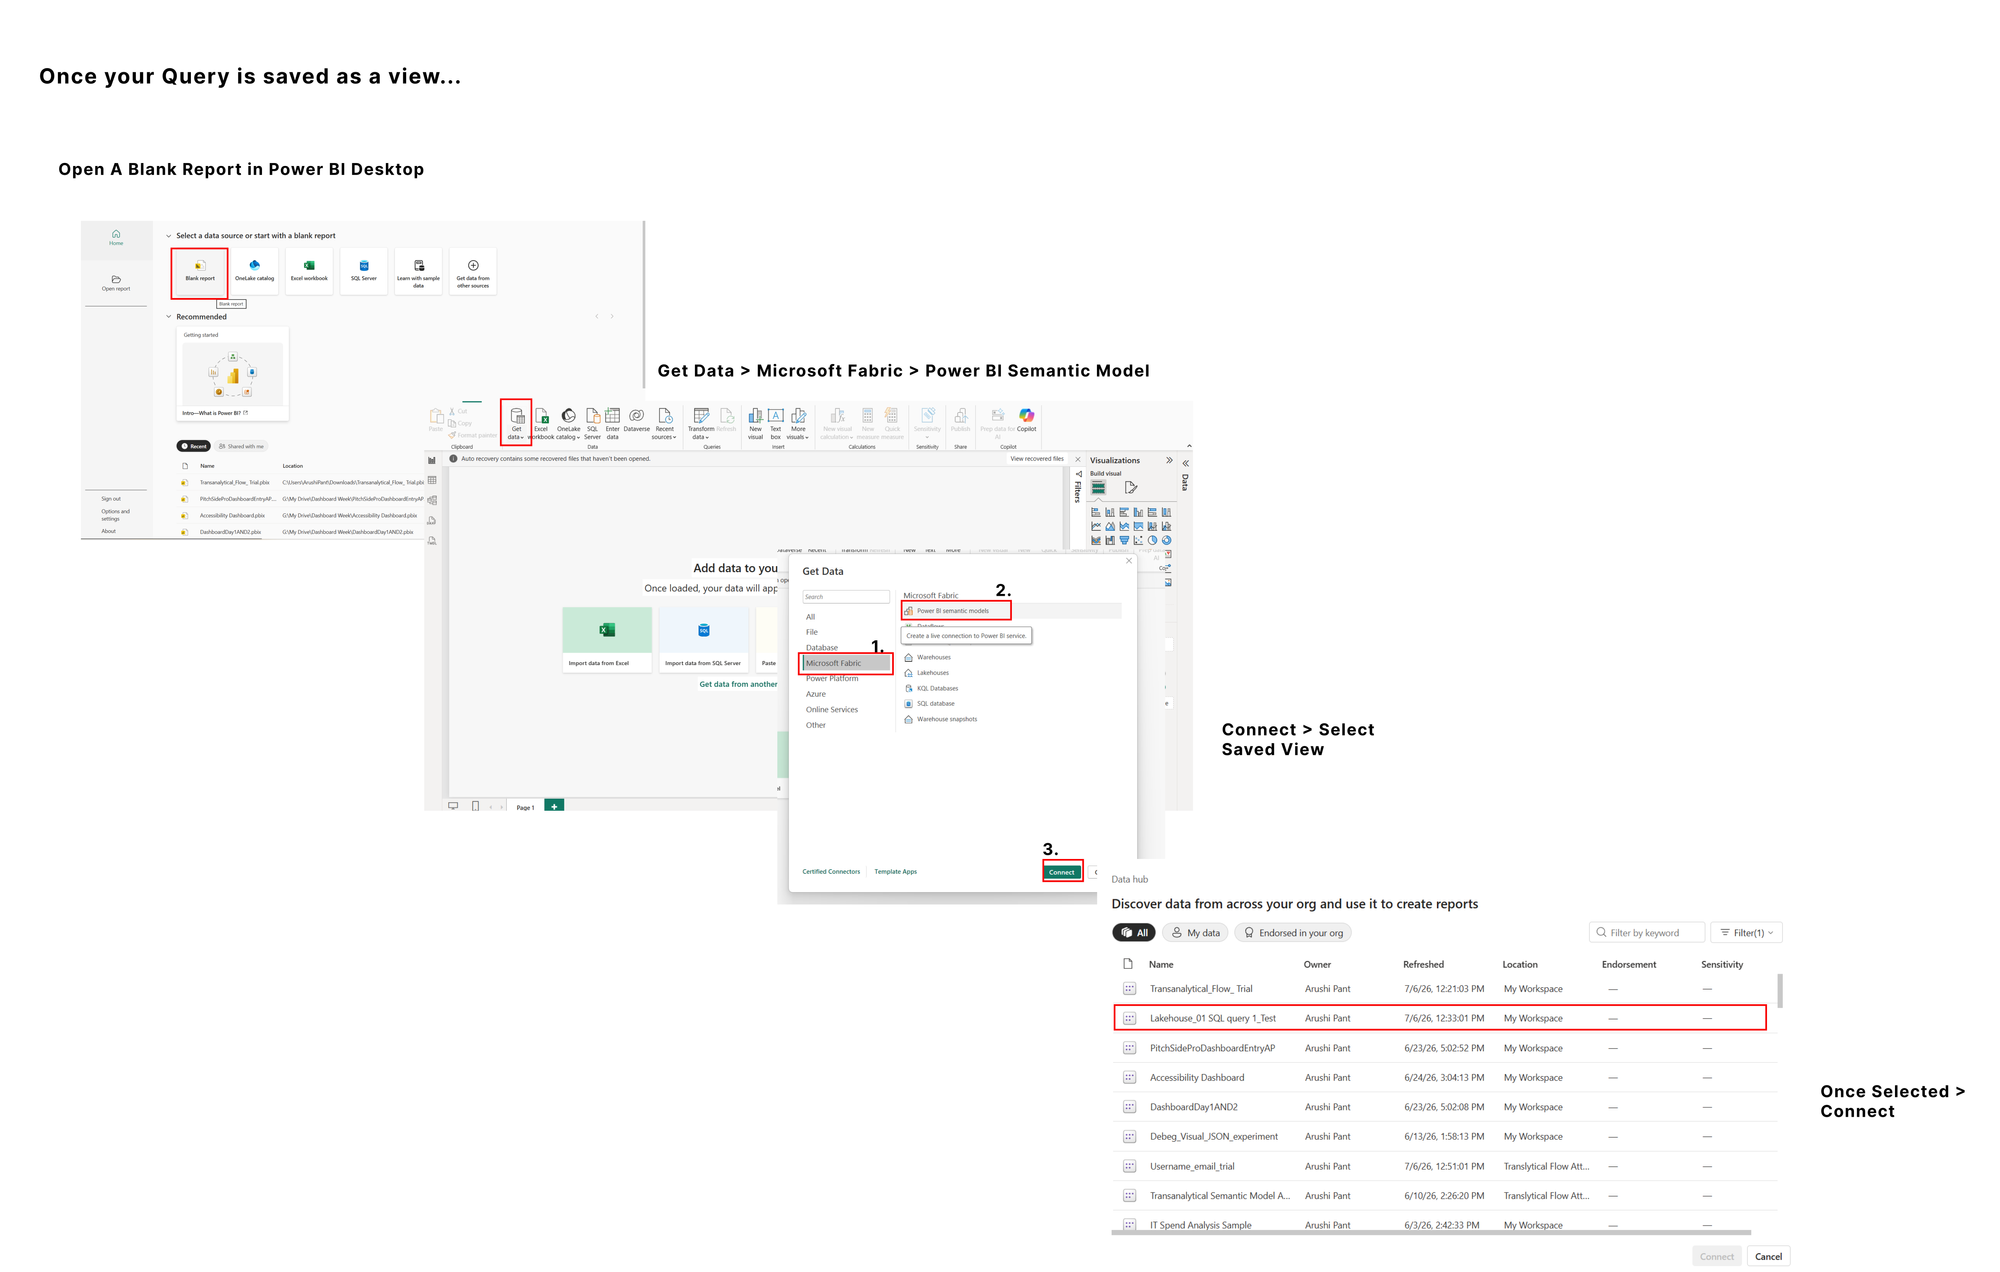
Connecting to a view created in Fabric Via Power BI Desktop