


This week, I took on the WorkOutWednesday NCAA Revenues & Expenses dataset challenges (Weeks 1-3), diving deep into Power Query and Power BI. It was an exciting opportunity to work through the full data process—cleaning, modelling, and visualising—all while building a strong foundation in data transformation.
Data Prepping – Surprisingly Enjoyable
One of the first steps was preparing the dataset in Power Query. While data prep is often seen as tedious, there’s something incredibly satisfying about transforming messy, inconsistent data into a structured, usable format. Cleaning up missing values, creating calculated columns, and standardising formats felt like piecing together a puzzle. It was a great reminder that strong analysis starts with well-prepped data.
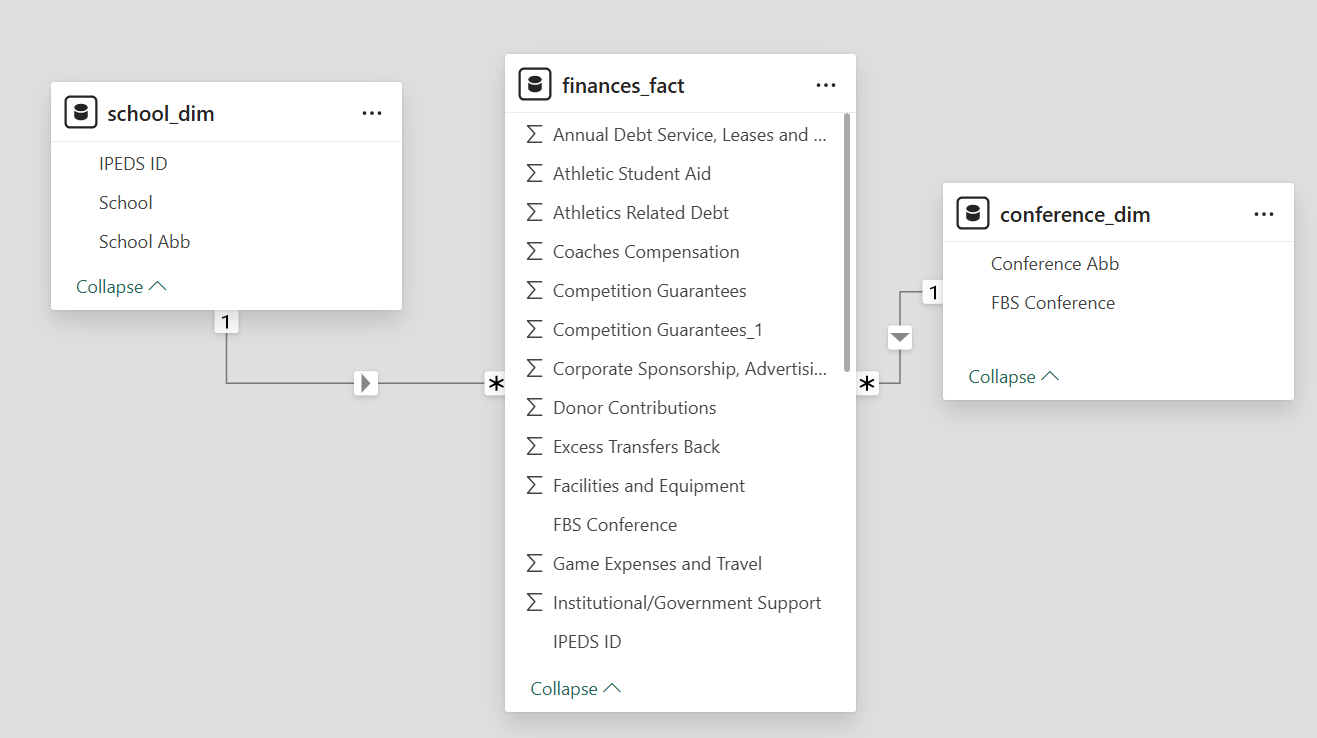
Building a Solid Data Model
With clean data in hand, we focused on structuring it properly. The dataset included financial data, school details, and conference affiliations, so establishing the right relationships was crucial. Using a star schema, we linked fact and dimension tables to ensure smooth aggregations and accurate insights. Along the way, we refined our understanding of primary and foreign keys, optimised table structures, and leveraged DAX to create useful measures for analysis.
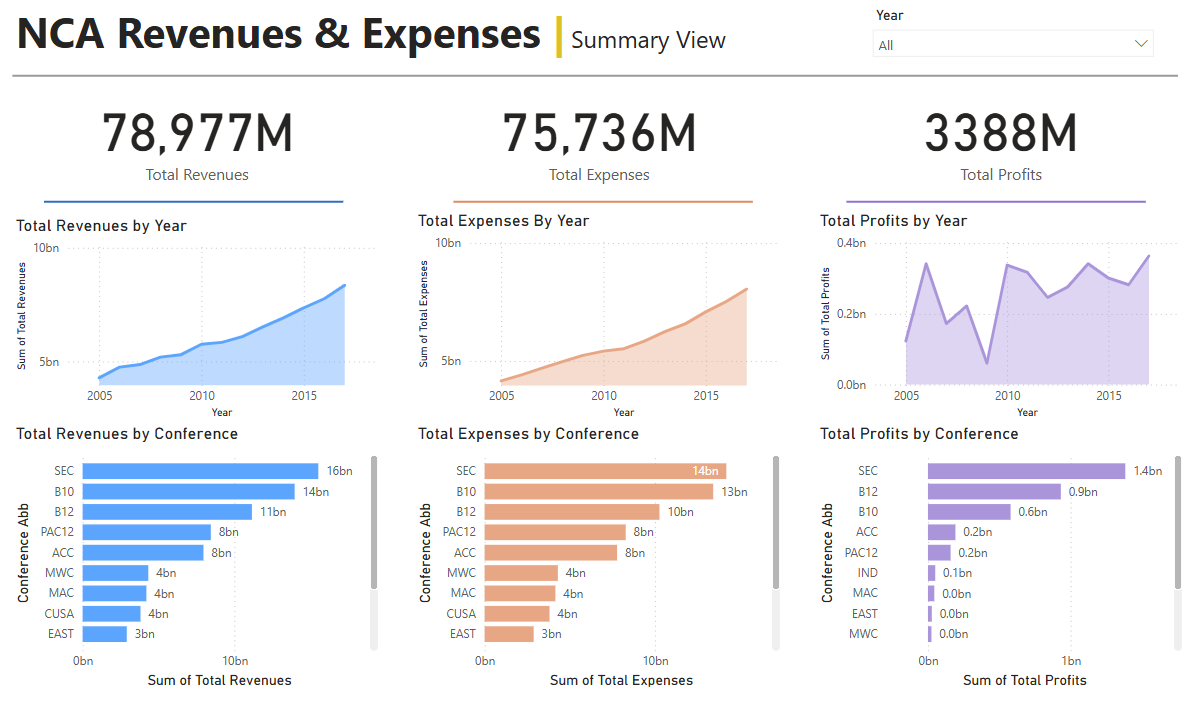
Bringing the Data to Life in Power BI
Once the model was set up, it was time to visualise the data. Power BI’s interactive tools made it easy to explore trends and comparisons. We built dashboards showing revenue and expense trends over time, highlighting key financial insights across different conferences. The process of selecting the right visualisations, applying filters, and designing a user-friendly layout was both challenging and rewarding.
Reflecting on the Experience
This first week with Power BI has been incredibly fun and engaging. Having previously worked with Tableau and Tableau Prep, it was interesting to see how Power BI differs. Each tool has its own strengths, and learning how to leverage them effectively is an exciting challenge. I can’t wait to dive deeper into M, DAX and continue expanding my skill set in Power BI!