


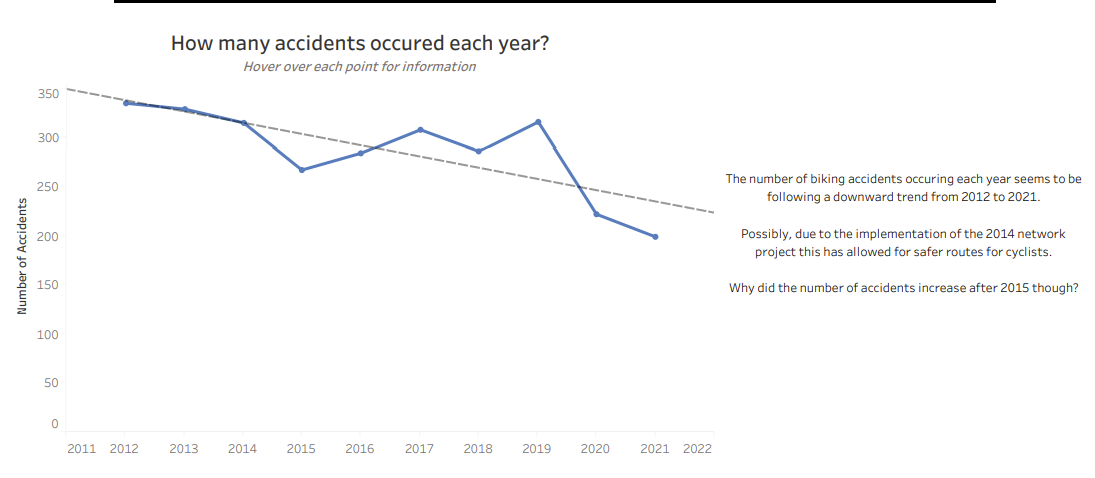
For DS34s week 2 presentations we had to rebuild our final Data School applications Viz with new techniques & calculations we have learnt from subsequent weeks. I chose to enhance my final Viz as I was pleased with the original outcome, however certain techniques that I have learnt would've made the analysis much clearer and easier.
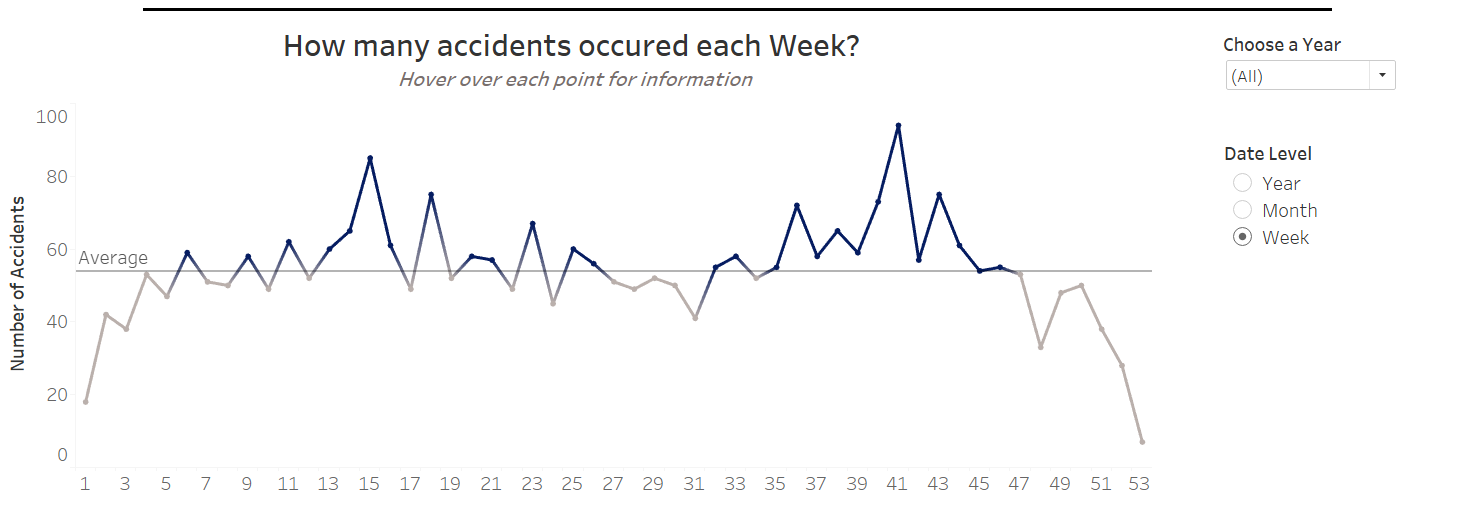
In the original Viz, this section of my analysis was incredibly dull and did not allow for greater depth of analysis. However, by implementing parameters it allowed for the user to adjust for the specific date level they would prefer, as seen in the screenshot below. An average line was also added which changed colour for the specific dates that had more bike accidents than the average during that time period.
The next major change I made on my application Viz was in regard to the severity of accidents:
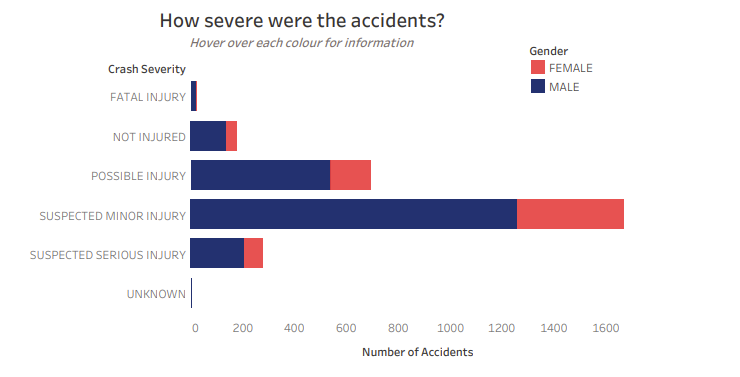
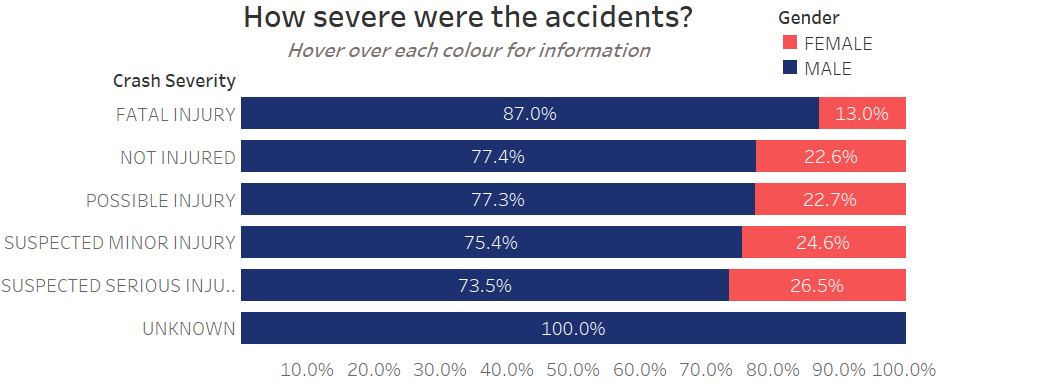
From the screenshot above, although it is clear to see the proportionality of male and female cyclists in varying severity levels of accidents. It is unclear to the user what the exact proportion is & the view may be hard to identify for certain severities, such as the 'Fatal Injury' severity. A change that I made for this one was to calculate each column as a percentage of the total for the specific dimension 'Gender', which allowed for the new chart as seen below.
The final major change I made to my application viz was to apply a parameter to the heat map that allows you to change for a preferred date level (Year, Month, Weekday, Hour etc.) & another parameter for both heat and hex map to change the variable being used to colour the map. The original Viz was..
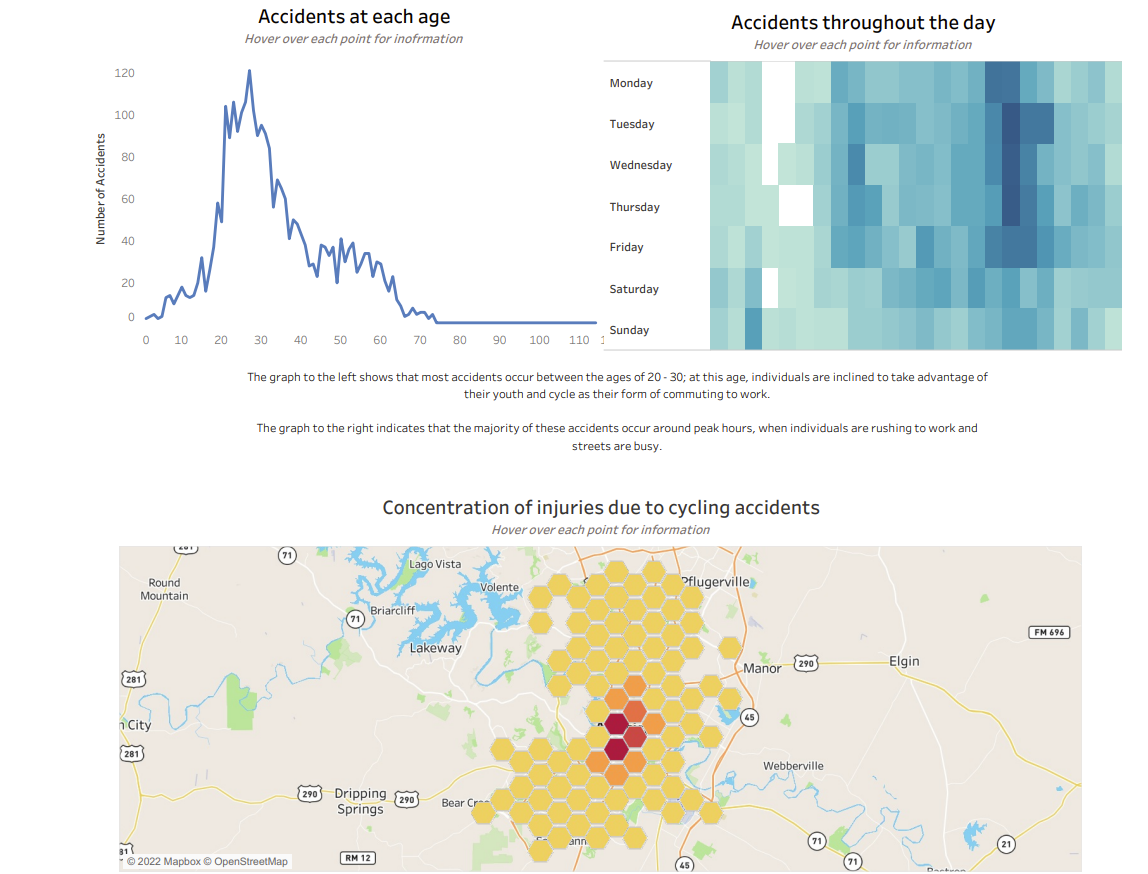
As you can see very it's very basic and it does not allow for an enhanced analysis, however after implement the changes, it allows for the user to dive into greater depth into what they would specifically prefer to view.
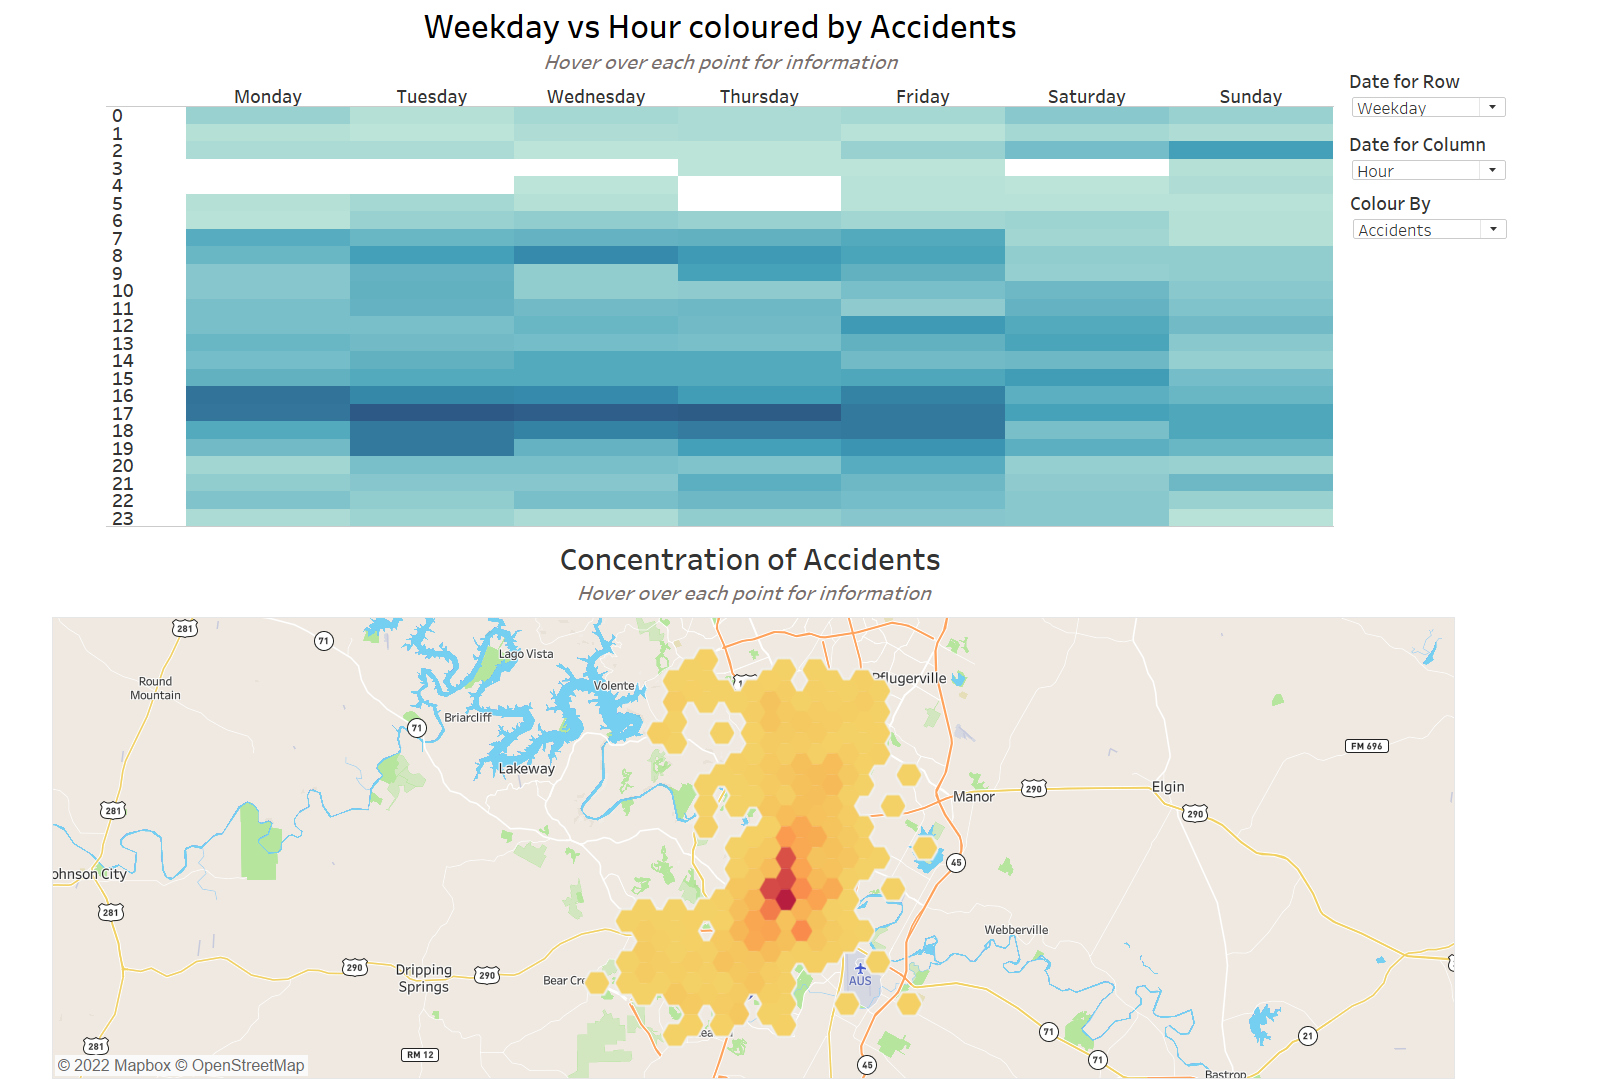
I also made it that the titles of each of the graphs that utilise a parameter would change accordingly to display the parameter that has been selected.
Furthermore, minor changes that I also made to the Viz was removing a majority of the text as I believe that with the changes I have made it covers a lot of the context, and there is no need for the user to read unnecessary information when they can view that information by selecting different variables themselves.