


Todays challenge was all about analysis, perfect! We've spent the last 4 months using Tableau, so what could go wrong? Well, it turns out those beautifuly cleaned excel files that you get given in training is a myth.
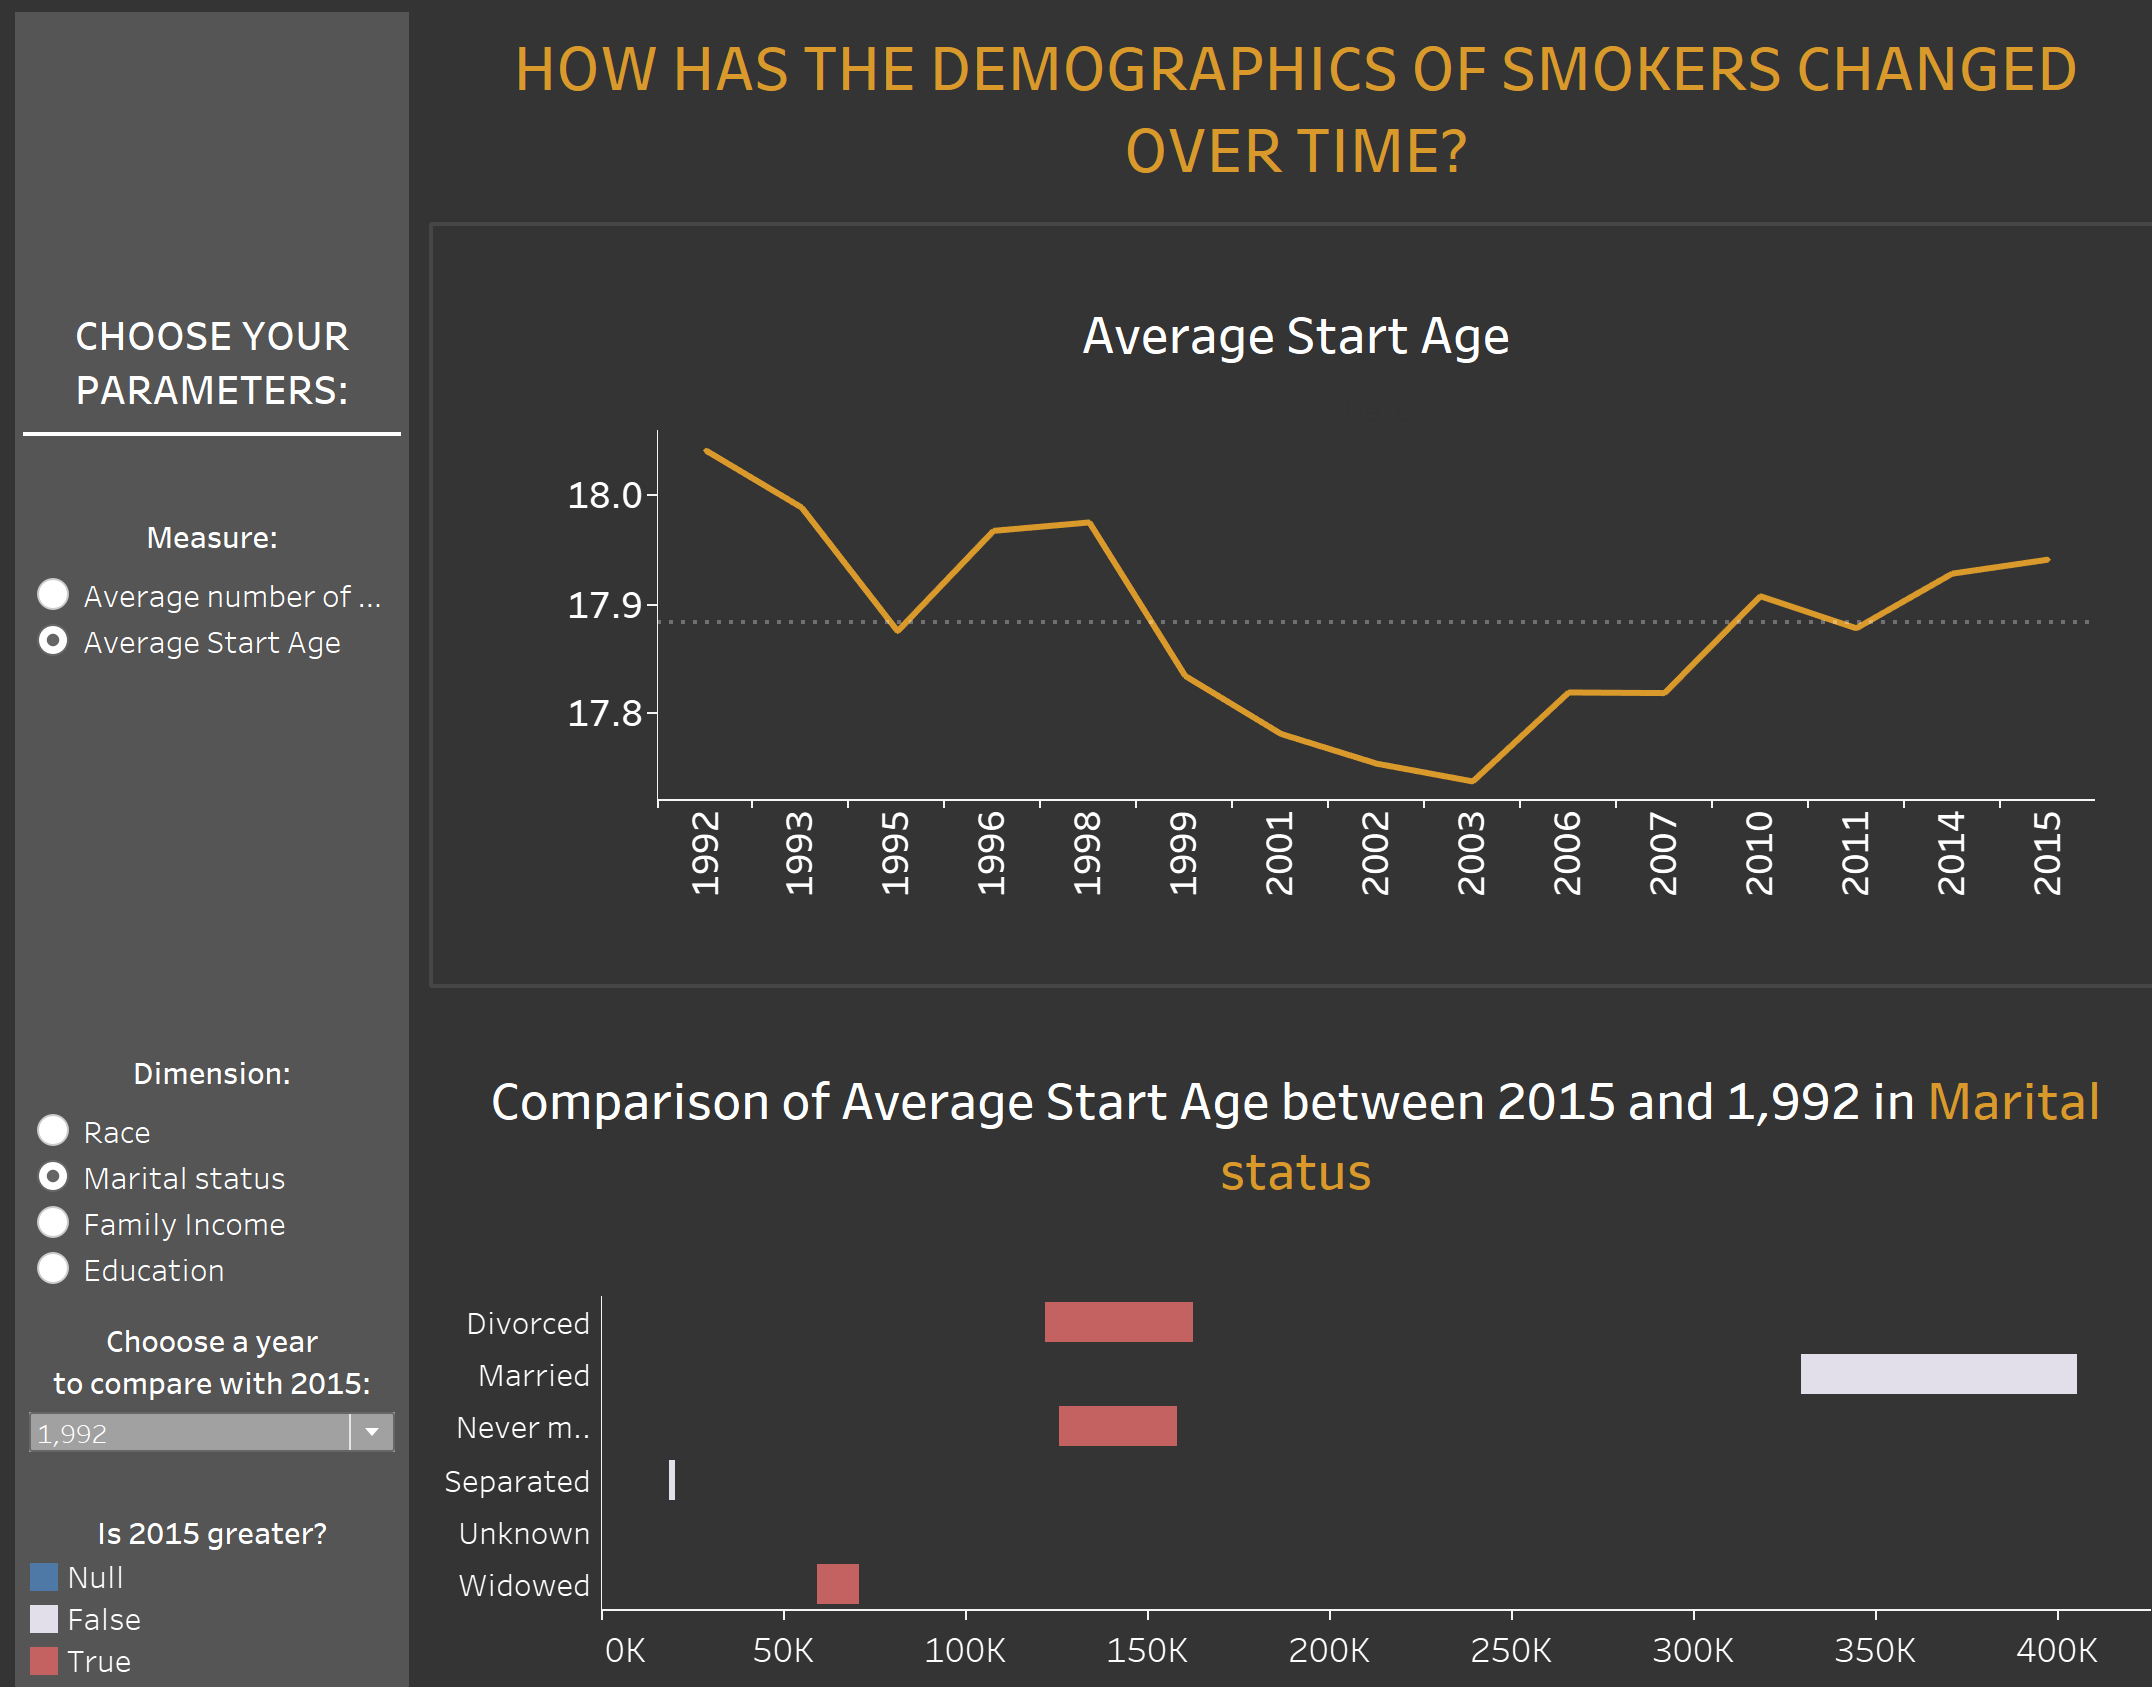
The task today was to analyse data regarding tobacco consumpsion. The main questions i wanted to answer was how the demegraphic of smokers have changed over the years and what technique has been most successful when trying to quite smoking.
The first challenge that I faced was to try and extract the data from the dat file. The solution was the set the Input Data tool in Alteryx to read it in as a fixed width, where the width was set to 701 characters (the maximum number of total characters in one record). After that, i used the splitstring function and the data dictionary to isolate the necessary fields that i needed to answer the questions. I extracted information regarding the demegraphics of the consumers and their smoking habits.
Unfortunately, I didn't have time to include the quitting techniques which would have gone on the next dashboard.